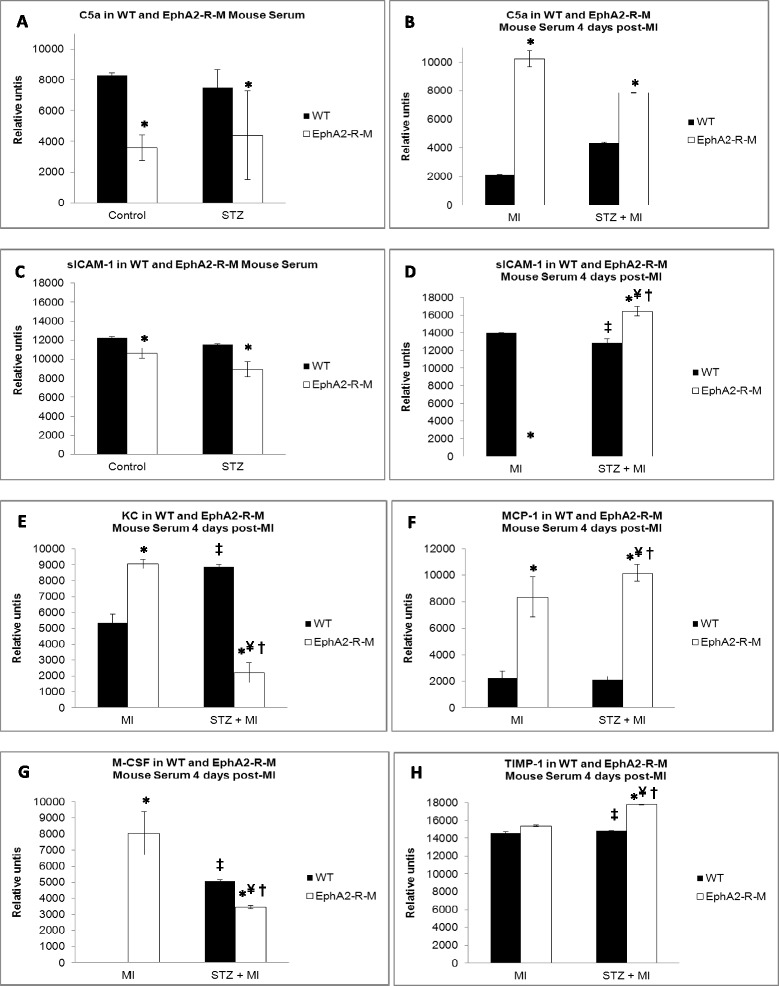
Figure 6.

Serum Cytokines in Normoglycemic and Hyperglycemic WT and EphA2-R-M mice. Panel A and C show the differences in C5a and sICAM-1 between normoglycemic and hyperglycemic WT and EphA2-R-M mice. Panel B and D shows how C5a and sICAM-1 change post-MI. Panels E-H show post-MI changes in WT versus EphA2-R-M mice in serum levels of KC, MCP-1, M-CSF, and TIMP-1. (p < 0.05: *different from WT, ●different from WT STZ, ‡different from WT 4d, ¥different from EphA2-R-M 4d, †different from WT 4d STZ).
