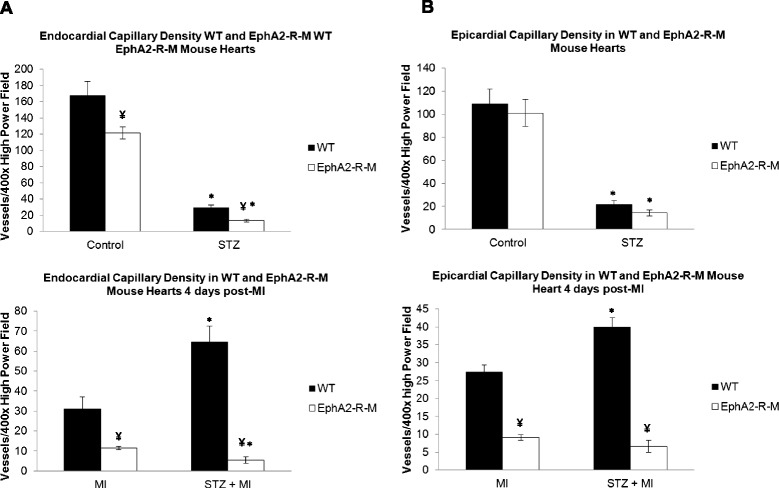
Figure 7.

Endocardial (A) and Epicardial (B) Capillary Density in WT and EphA2-R-M hearts. A: The top graph shows the capillary density in the endocardium of uninjured control hearts from normoglycemic (left) and hyperglycemic (right; STZ) hearts (top; *Different from control, p < 0.001; ¥ Different from WT, p < 0.01) and hearts 4 days post-MI (bottom; *Different from MI, p < 0.001; ¥ Different from WT, p < 0.01). B: The top graph shows the capillary density in the epicardium of uninjured control hearts from normoglycemic (left) and hyperglycemic (right; STZ) hearts (*Different from control, p < 0.001) and hearts 4 days post-MI (bottom; *Different from MI, p < 0.01; ¥ Different from WT, p < 0.001).
