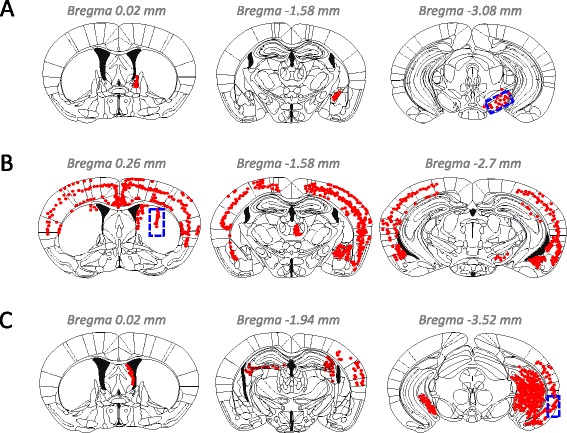
Figure 1.

Distribution of phosphorylated αsyn pathology in αsyn fibril-injected mice at 1 month after injection. (A) Injection into SN induced αsyn pathology mainly in SN (3.08 mm posterior to bregma), amygdala (1.58 mm posterior to bregma) and stria terminalis (0.02 mm anterior to bregma). (B) Injection into Str induced severe αsyn pathology throughout the brain, including Str (0.26 mm anterior to bregma), amygdala (1.58 mm posterior to bregma), SN (2.70 mm posterior to bregma) and a wide range of cortex. (C) Injection into EC induced αsyn pathology that was concentrated in EC (3.52 mm posterior to bregma), dentate gyrus (3.52 mm posterior to bregma), CA3 (3.52 mm posterior to bregma), fimbria (1.94 mm posterior to bregma), and septal nucleus (0.02 mm anterior to bregma). Blue-dashed box and red dots indicate the injection site and psyn pathology, respectively.
