
Fig. 1.
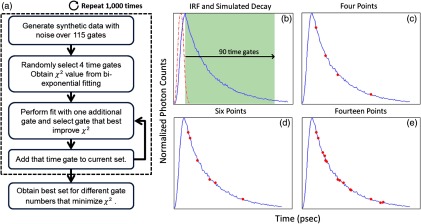
(a) Workflow of the in silico study. First, noisy synthetic data are generated over a 4.6-ns temporal window and is estimated using four random time gates as the measurement dataset. Then, best additional gates are estimated iteratively until the dataset is comprised of 14 gates. The overall process is reproduced 1000 times. (b) A representative experimental IRF and synthetic fluorescence decay curve are shown; the solid area corresponds to the temporal range of 90 time gates that may be used for fitting. (c–e) A representative decay at several iterations in the gate selection process.