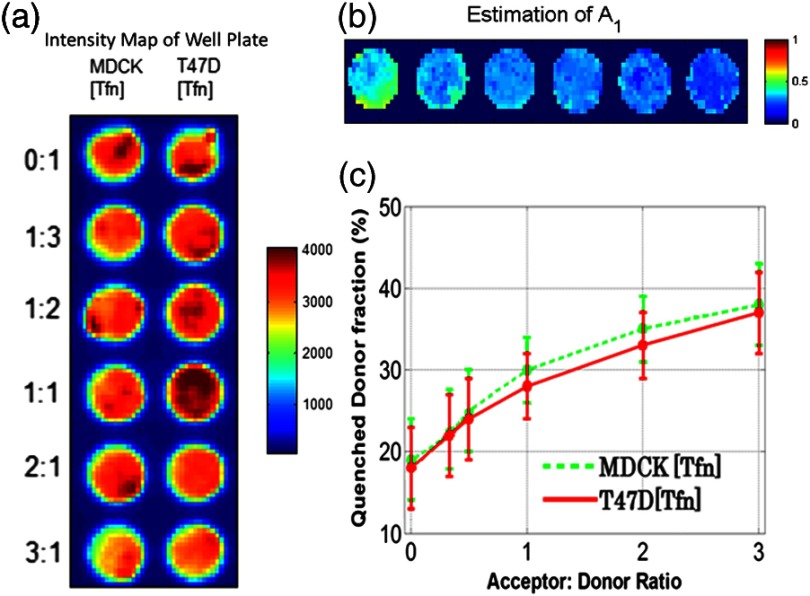
Fig. 2.
(a) Example results of photon counts at the maximum of the decay curve with different cell lines and AD ratios over the 12 wells. The counts are close to the maximum photon counts that can be acquired by the gated ICCD thanks to AWFI. (b) Example of model parameter estimation over row 1 (MDCK) of the sample. Here only is depicted, as it is the parameter of interest for the application. (c) Quenched donor fraction () estimation over the whole sample. Mean values for each well with standard deviation are reported when estimated with the full temporal dataset.

