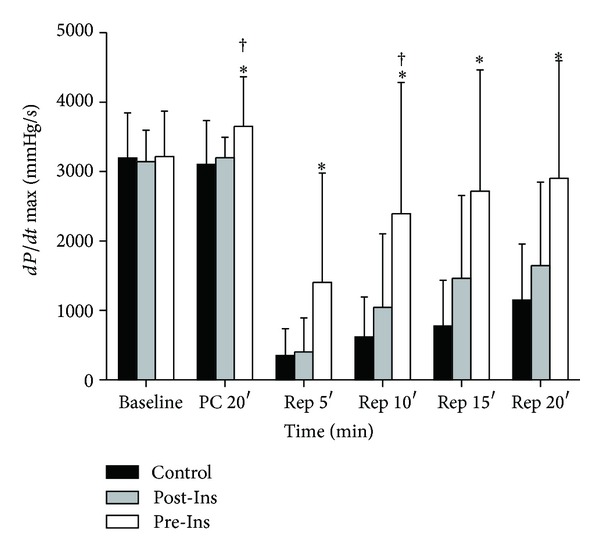
Figure 4.

Time-course changes of LV dP/dt max before and after ischemia in the three groups (n = 12 in each group). The data are presented as means ± SD. *P < 0.05 versus Control; † P < 0.05 versus Post-Ins. In Pre-Ins, LV dP/dt max increased after administration of insulin prior to ischemia (PC 20′) compared to both Post-Ins and Control. After reperfusion, dP/dt max in Pre-Ins was elevated, compared with Post-Ins at 10 minutes after reperfusion (Rep 10′) and Control at all-time points (Rep 5′, 10′, 15′, and 20′). dP/dt max (mmHg/sec): maximum of left ventricular derivative of pressure development.
