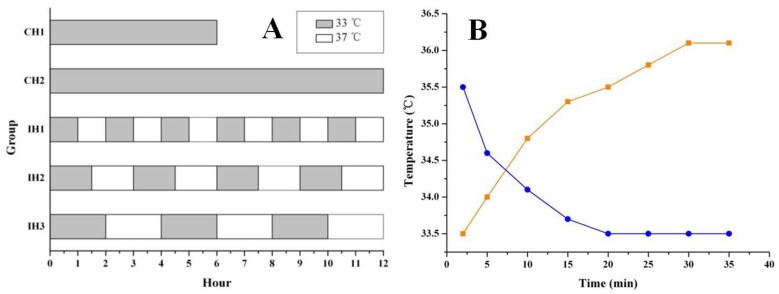
Figure 1.
Graph A showing the hypothermia administration after OGD. The gray stripe represented the hypothermic culture time at 33℃. The white gaps were normothermic intervals at 37℃. The real temperature change in culture vessel was monitored at different time points until the platform (graph B). The blue/orange curves showed the cooling/rewarming cycles in hypothermic/normothermic incubator.

