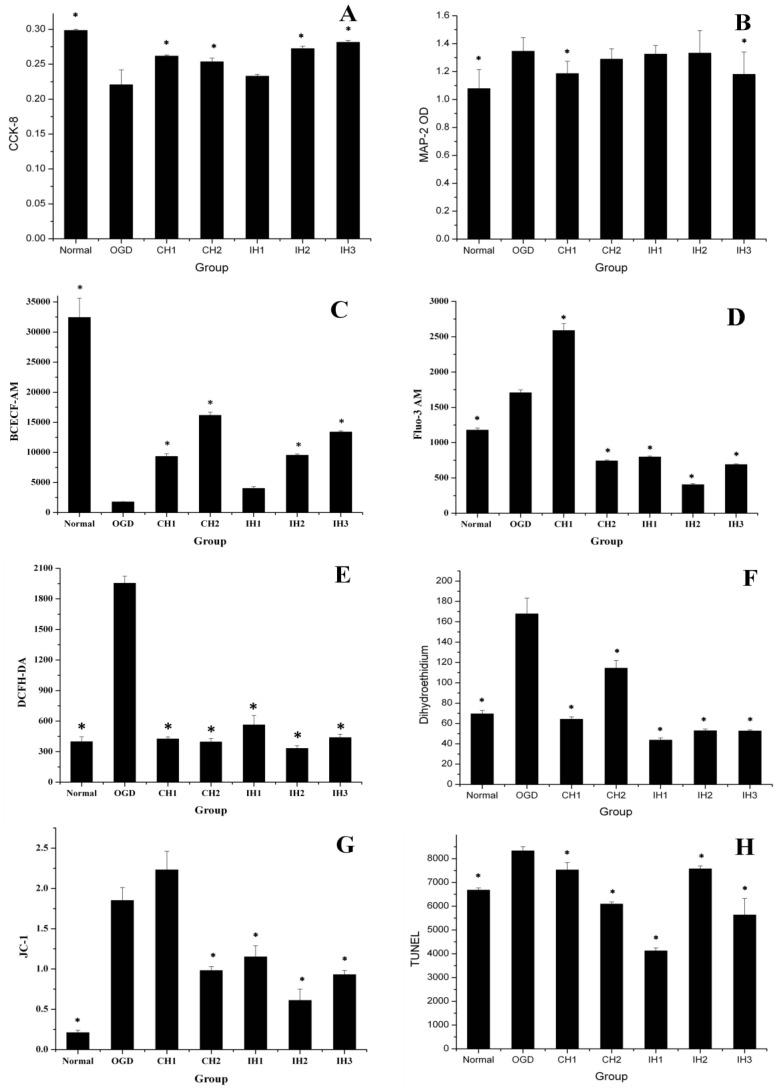
Figure 5.
The overall data suggested that different hypothermia strategies provided different levels of neuroprotection. (A) CCK-8 = Cell viability (n=8). (B) MAP-2 = Microtubule associated protein 2 (n=10). (C) BCECF-AM = pH (n=4). (D) Fluo-3 AM = Free calcium ion (n=5). (E) DCFH-DA = ROS (n=3). (F) Dihydroethidium = Superoxide anion (n=5). (G) JC-1 = Monomer/J-aggregates (n=3). (H) TUNEL (n=5). *p<0.05, compared with OGD group.

