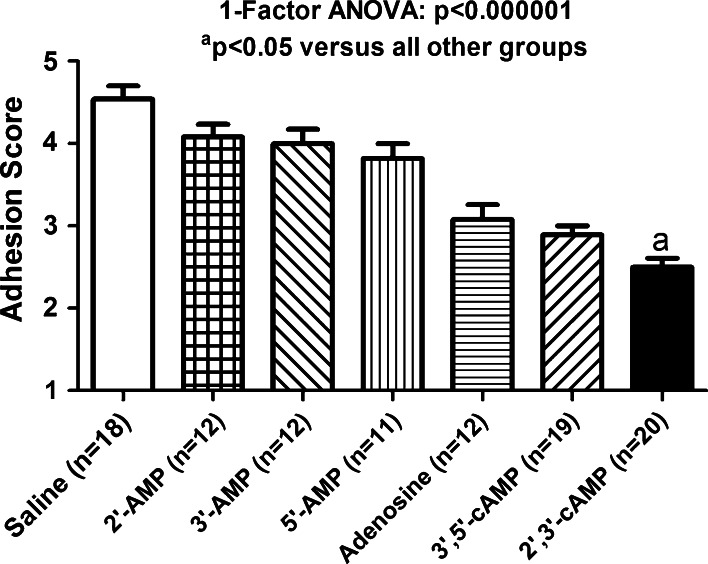
Fig. 1.
Bar graph shows the adhesion scores of mice treated with a single intraperitoneal dose of the indicated treatment. Each compound was administered into the peritoneal cavity at a concentration that was approximately the limit of solubility for that compound (23 mmol/L for adenosine and 75 mmol/L for all other purines). Values are means and SEMs

