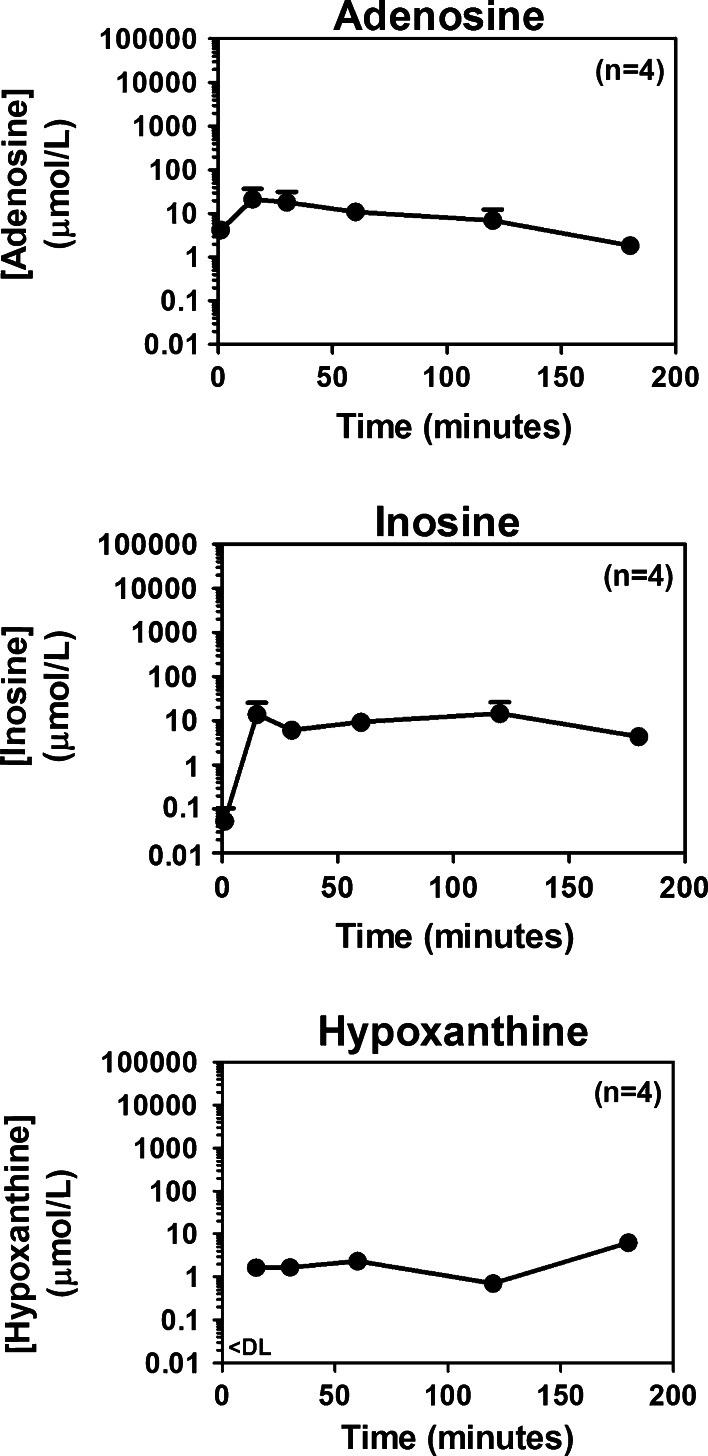
Fig. 3.
Line graphs illustrate the relationship between time (1–180 min) after administration into the peritoneal cavity of 2′,3′-cAMP (1 mL of a 75 mmol/L solution) and concentrations of adenosine, inosine and hypoxanthine. The level of hypoxanthine at 1-min post-administration was below the assay’s detection limit (<DL). Values are means and SEMs

