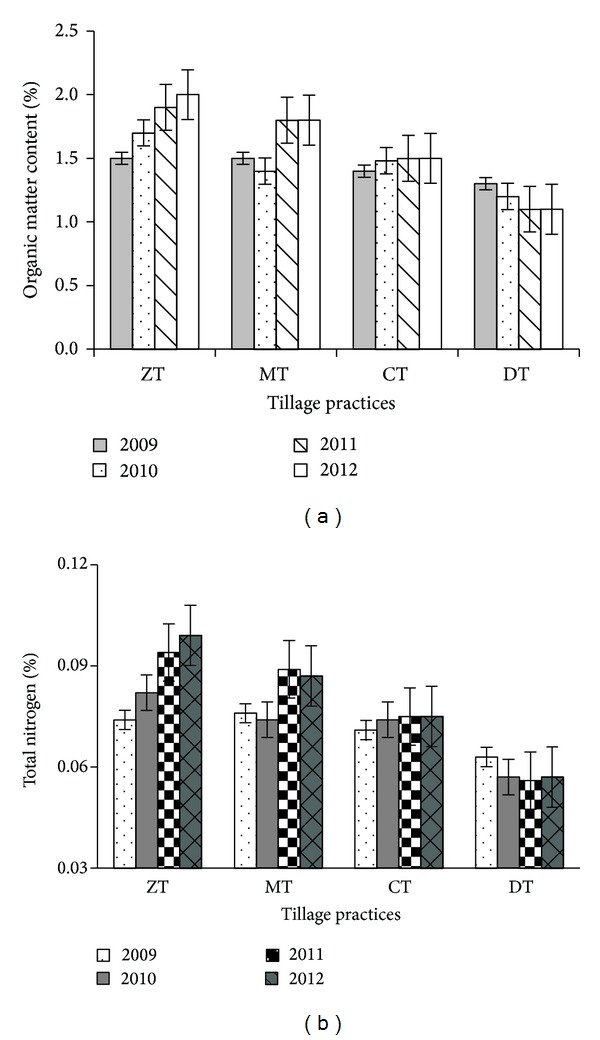
Figure 8.

Change in soil organic matter (a) and total nitrogen (%) (b) due to different tillage practices (most recent year first). Notes: ZT: zero tillage, MT: minimum tillage, CT: conventional tillage, and DT: deep tillage. Means ± SE are shown in error bar (P ≤ 0.05).
