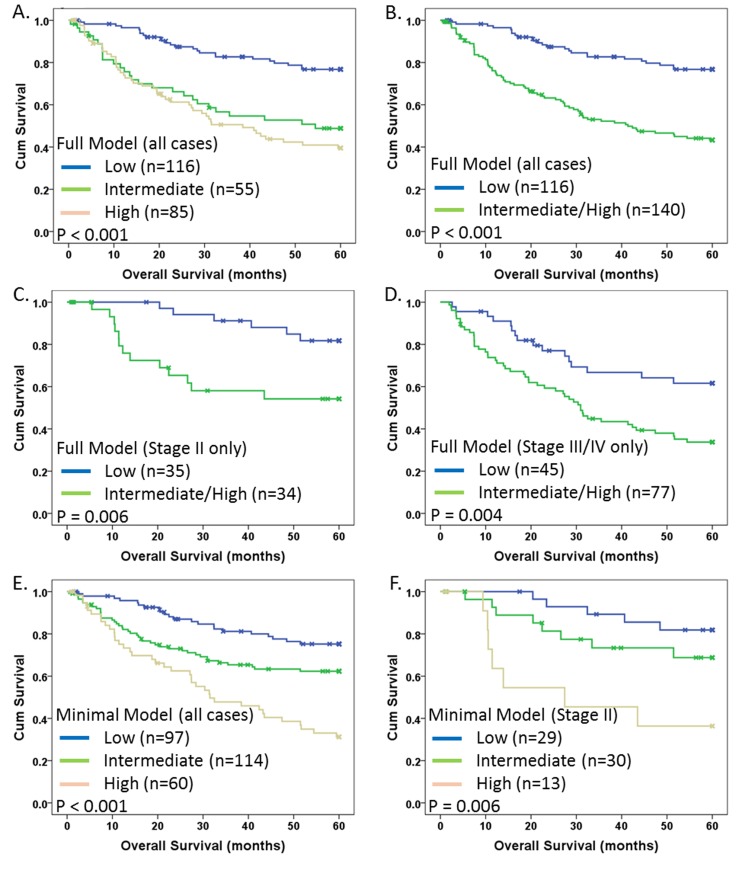
Fig 5. Kaplan-Meier survival analysis of TAPPS modeling.
Kaplan-Meier 5-year disease specific survival analysis with indicated p-values for TAPPS risk groups for indicated patient groups: (A) Full model with all cases using 3 risk groups; (B) Full model with all cases using 2 risk groups (high and intermediate from (A) combined into single high risk group); (C) Full model with only Stage II cases; (D) Full model with only Stage III/IV cases; (E) Minimal model (mTAPPS) with all cases (3 risk groups); and (F) mTAPPS with Stage II only (3 risk groups). (A,E,F): Blue, green, and beige lines indicate low, intermediate and high risk groups respectively. (B,C,D): Blue and green lines represent low and high risk groups, respectively. X-marks indicate censored cases.

