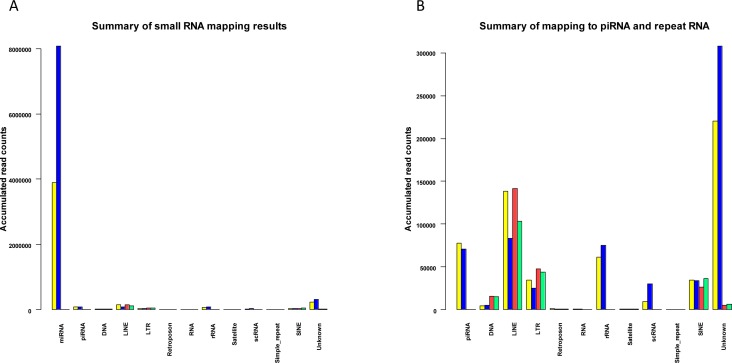
Figure 6. Summary of mapped small RNAs for L1-active and L1-silenced libraries.
(a) Barplot showing an overview of the accumulated normalized read counts after mapping L1-active and L1-silenced libraries against miRBase, human deepBase sense and antisense rasRNA.fasta and the human piRNABank database. Colour bars: For reads mapped to miRBase and piRNABank: L1-active reads, yellow; L1-silenced reads, blue. For reads mapped to deepBase: L1-active sense reads, yellow; L1-silenced sense reads, blue; L1-active antisense reads, red; L1-silenced antisense reads, green. (b) Higher magnification view of Fig6a after omitting reads mapped to miRBase.

