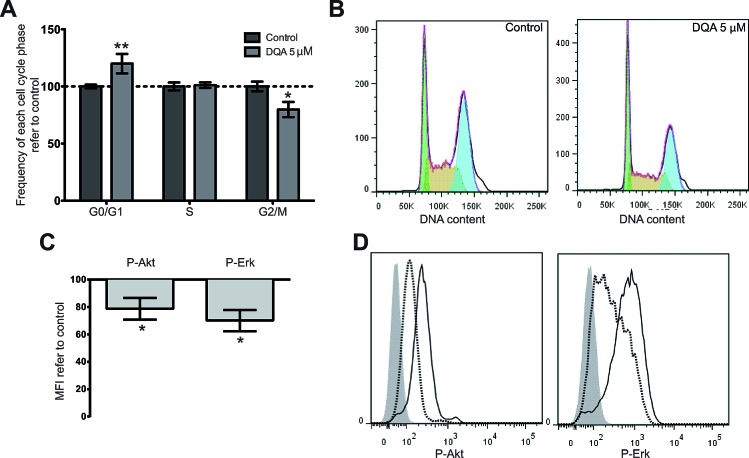
Figure 2. DQA treatment induces cell cycle arrest and downregulation of P-Akt, P-Erk and P-Stat3.
HL-60, KG-1, MonoMac-1 and Kasumi-1 were treated with 5 μM DQA and cell cycle was analyzed by flow cytometry 48 h after treatment. A. Relative frequency of G0/G1, S and G2/M phases in control- vs. DQA-treated AML cells. Bars represent the mean value of all AML cell lines and error bars represent SEM. B. Representative DNA content flow profile of control- (left) and DQA-treated (right) HL-60 (green represents G0/G1 phase; yellow, S phase; blue, G2/M phase). P-Akt and P-Erk expression levels by flow cytometry in AML cell lines after treatment with 5 μM DQA for 24 h. C. Mean fluorescence intensity of each staining was normalized against vehicle-control treated sample and data from all AML cell lines tested is represented. D. Representative flow histograms of P-Akt (left), P-Erk (centre) and P-Stat3 (right) intracellular staining of DQA-treated HL-60 AML cells. Shadow, negative control; solid line, control treated sample; dashed line, DQA-treated sample. * p<0.05; ** p<0.005.

