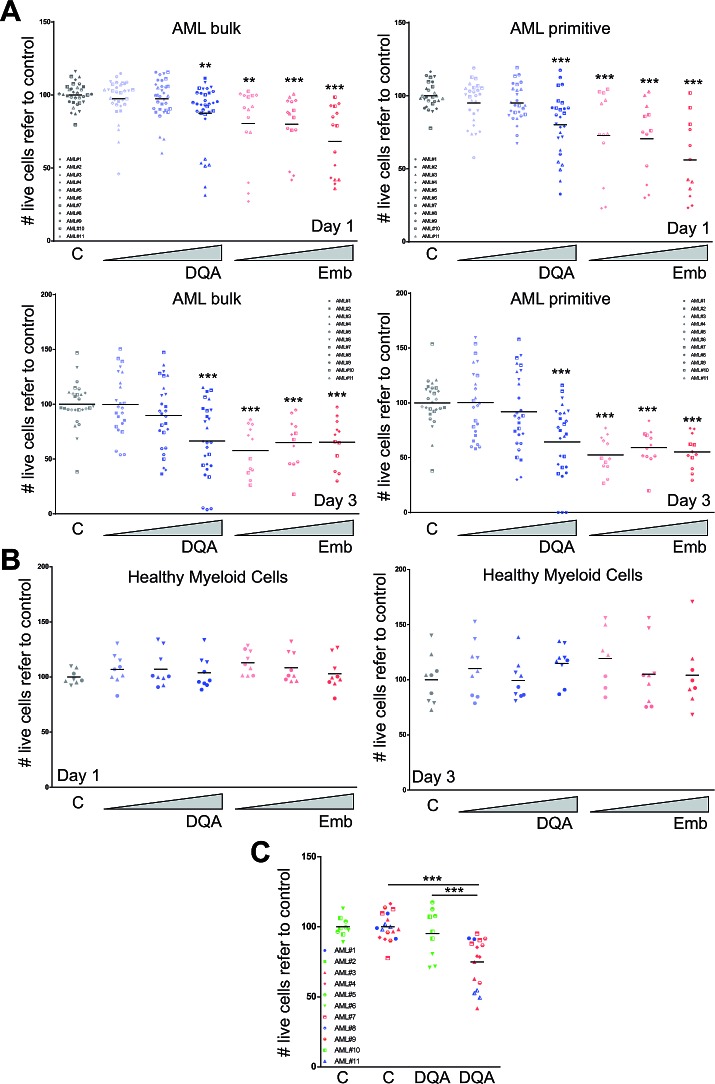
Figure 3. DQA and embelin treatment induces cell death in AML primary blasts by preferentially affecting LSC population and reduces clonogenic capacity.
AML primary blasts A. or healthy myeloid blood cells B. were treated with different concentration of DQA (0.05, 0.5, 5 μM) and embelin (0.1, 1, 10 μM). Cell viability was analysed at day 1 (upper panels) and 3 (lower panels) after treatment. Each symbol corresponds to a single AML patient sample, specified in the graph legend. Bulk population corresponds to AML blast cells and the primitive fraction corresponds to a CD34+CD38- blast population. C. Primary AML patient samples were treated for 24 h with 5 mM DQA. Cell viability was measured by flow cytometry (volumetric counts on live 7-AAD− cells). Each symbol corresponds to an AML patient sample. Green, favourable risk group; blue, intermediate risk group; red, unfavourable risk group. * p<0.05; ** p<0.005; *** p<0.0005.

