
Figure 2. Cytotoxicity induced by DCA in B leukemic cell lines.
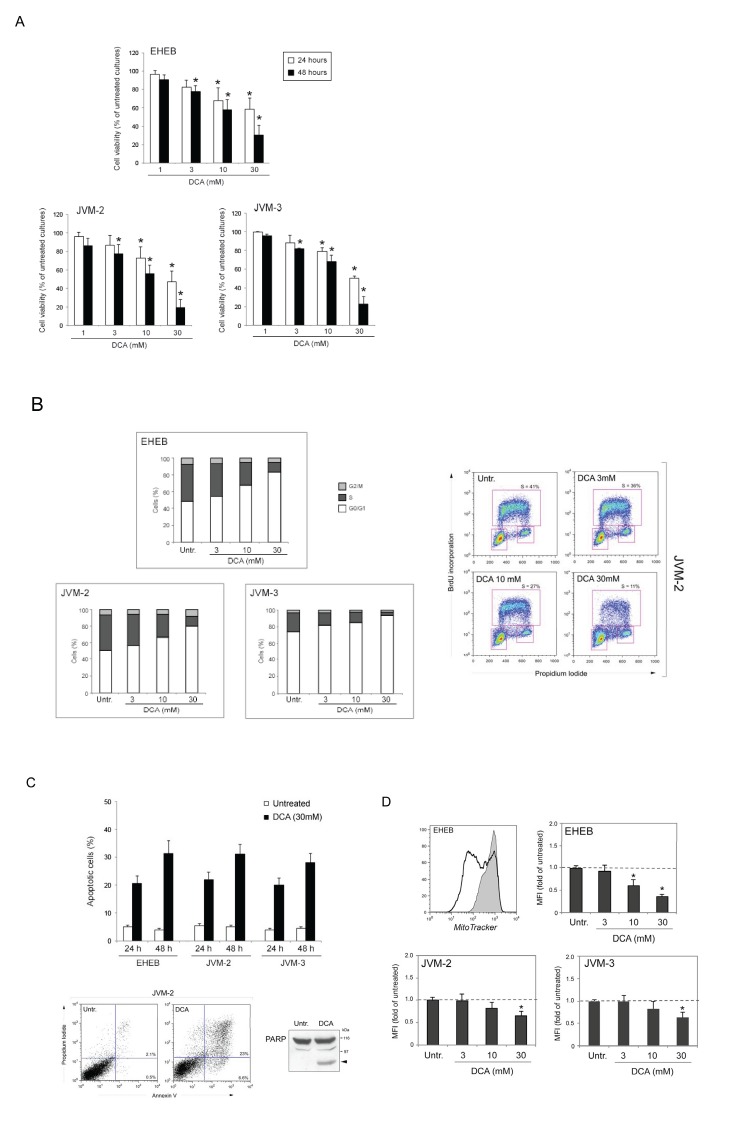
The p53wild-type (EHEB, JVM-2, JVM-3) B leukemic cell lines were exposed to DCA before analysis of cell toxicity. In A, cell viability in response to serial doses of DCA (range 1-30 mM), was calculated at both 24 and 48 hours of treatment as percentage with respect to the control vehicle cultures (set to 100% for each cell line). In B, cell distribution in the different phases of cell cycle was calculated from the flow cytometry dot plots after BrdU/PI staining and expressed as percentage of the total population. Representative cell-cycle profiles of cells, either left untreated or treated with serial doses of DCA, analyzed by flow cytometry are shown. In the right panel, the rectangles represent the cells in G0/G1, S, G2/M phases of the cell cycle. In C, the percentage of apoptotic cells was determined by flow-cytometry after Annexin V/PI staining (upper panel). A representative flow cytometric analysis of apoptosis, validated also by Western blot analysis of PARP cleavage, is shown (lower panels). In D, to measure changes in the mitochondrial membrane potential (ΔYm), upon treatment with DCA for 24h cells were stained with MitoTracker solution and analyzed by flow cytometry. Median values of mitochondrial MitoTracker fluorescence and representative histograms are shown. In A, C and D, data are reported as the mean±SD of results from three independent experiments. In A and D, the asterisk indicates p<0.05 with respect to the untreated cultures of each cell line.