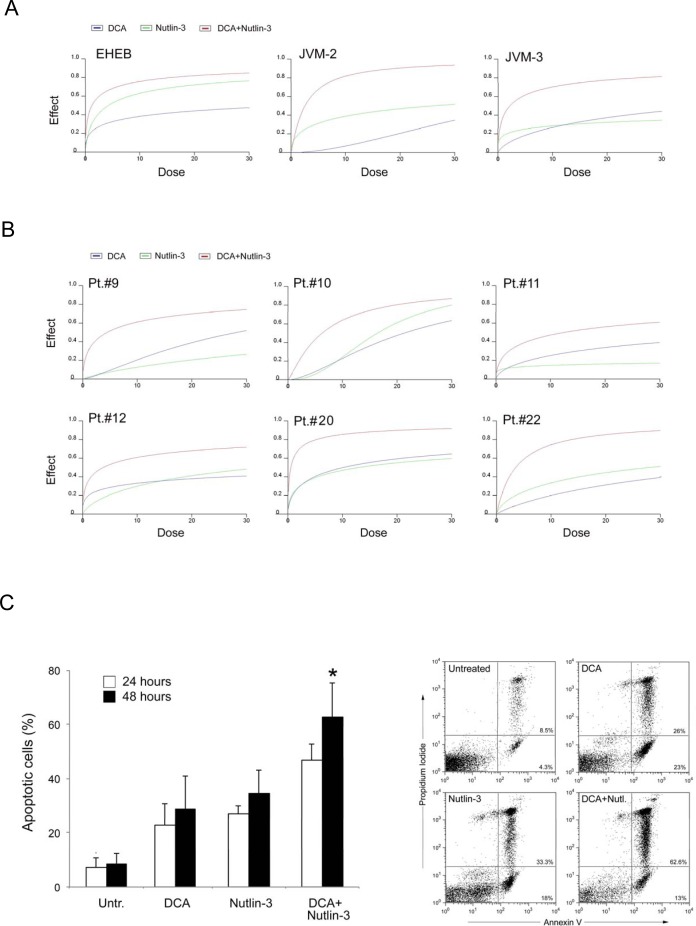
Figure 4. Cytotoxicity by DCA and Nutlin-3 used alone or in combination in p53wild-type B leukemic cells and B-CLL patient leukemic cells.
p53wild-type B leukemic EHEB, JVM-2 and JVM-3 cells and B-CLL patient leukemic cells were exposed to serial doses of DCA or Nutlin-3 used either alone or in combination, with a fixed ratio, for 24 hours. Dose-effect plots, to determine drug efficacy, are shown for each cell line (A) and for representative B-CLL patient samples (B). The decrease of cell viability, labeled “effect” on the Y-axis, was determined in assays done at least twice in duplicate. In C, induction of apoptosis in B-CLL patient leukemic cells was calculated as percentage of Annexin V/PI cells. Data are reported as mean±SD of results from three independent experiments. A representative flow cytometric analysis of apoptosis in a primary B-CLL sample is shown. The asterisk indicates p<0.05 with respect to cultures treated with either DCA or Nutlin-3 alone.

