
Figure 2. Tumor cell response to temozolomide, SAHA or their combination in human melanoma cell lines.
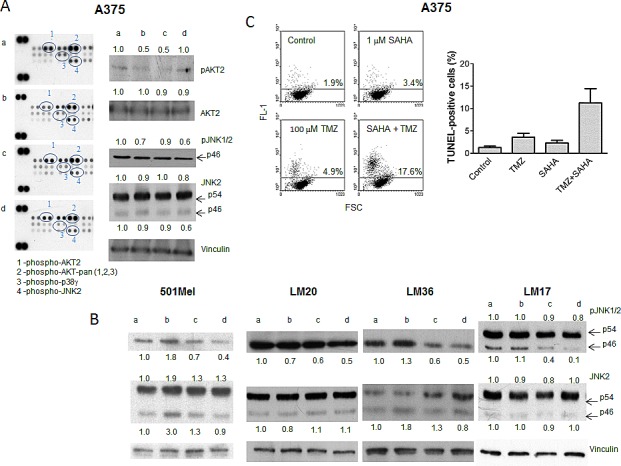
Cells were incubated with single drugs or their combination and processed 24 h later for Human Phospho MAPK Proteome Profiler (A), and Western blot analyses of phospho-JNK1/2 and JNK2 (B), or 72 h later for TUNEL assays (C). Small case letters refer to control (a), SAHA (b), temozolomide (TMZ) (c) or combination (d) treatments. 501Mel cells were exposed to 0.1 μM SAHA, 30 μM TMZ or to their combination (B). A375 cells were exposed to 1 μM SAHA, 30 μM TMZ, or to their combination (A, B); LM20 cells were exposed to 0.1 μM SAHA, 600 μM TMZ, or to their combination (B); LM36 cells were exposed to 0.1 μM SAHA, 30 μM TMZ, or to their combination (B); LM17 cells were exposed to 1 μM SAHA, 300 μM TMZ, or to their combination (B). Control loading is shown by vinculin. The ratio between the intensity of the indicated bands versus vinculin is reported (B). Quantitative analysis of apoptosis induction by TUNEL assays in A375 cells. Dot plots from a representative experiment and a graph from three independent experiments are shown; P = 0.032, unpaired t test of values from control versus combination-treated cells (C).