
Figure 3. In vivo studies.
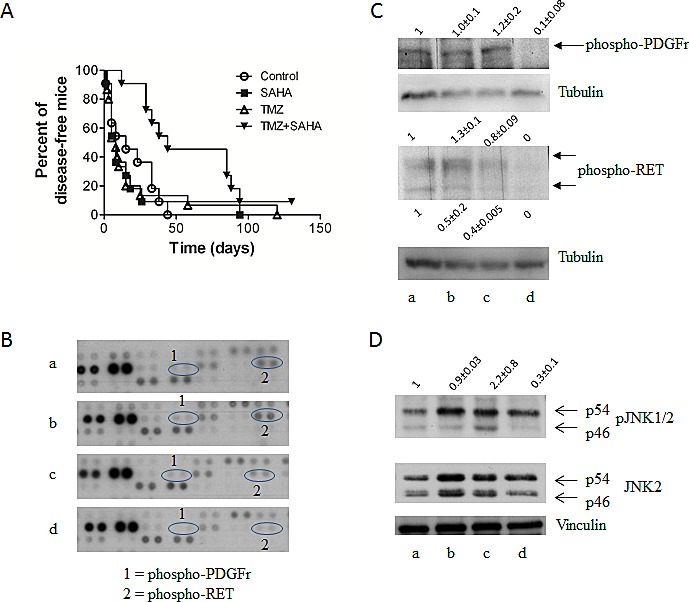
(A) Antitumor activity as shown by Kaplan Meier plots of the percentage of tumor-free mice over time. Mice were treated with temozolomide (TMZ) (50mg/kg qdx5) or SAHA (100mg/kg qdx5/wx4w) and their combination. Circles, control mice; squares, SAHA-treated mice; upright triangles, TMZ-treated mice, downright triangle, drug combination. Experimental groups consisted of 11-16 mice. (B) Phosphorylation of proteins involved in tumor cell survival as assessed by the mouse Phospho-RTK Proteome Profiler using lysates of tumors from control (a), SAHA (b), TMZ (c) or combination-treated (d) mice. Mice were treated as described above for 5 days and they were sacrificed 5 days later. Tumor cells were processed for total protein extraction. (C) Validation of Proteome Profiler by Western blotting. Analysis of phospho-PDGF receptor and phospho-RET in tumor specimens from control (a), SAHA (b), TMZ (c) or combination (d) treated mice. Control loading is shown by tubulin. Relative quantification mean values (± SD) of 3 independent experiments are shown. (D) Western blot analysis phospho-JNK1/2 and JNK2 in tumor specimens from control (a), TMZ (b), SAHA (c) or combination (d) treated mice. Control loading is shown by vinculin. Relative quantification values are shown.