Figure 10.
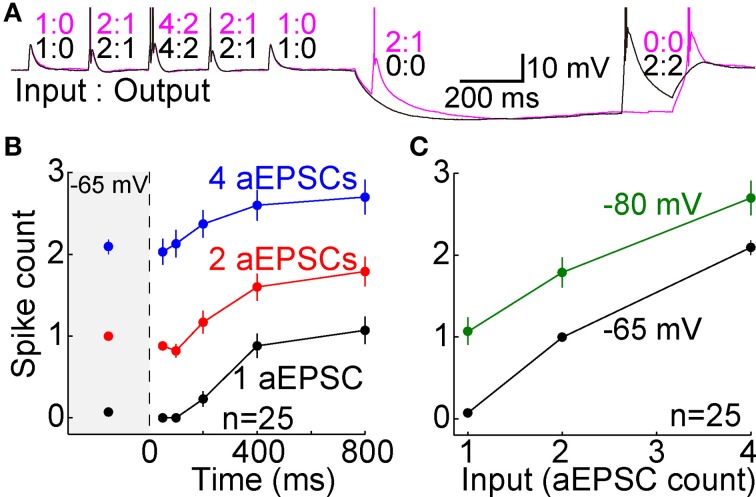
T-type channels cause excessive spike counts when activated in a low conductance state. (A) Voltage recording from a single cell. Fully analogous to our standard aEPSC experiment shown in Figure 4B, but performed without artificial conductances. Both hyperpolarization and aEPSPs were achieved solely by current injection (aEPSCs in “current clamp” rather than aEPSGs in “dynamic clamp”). The higher membrane resistance may account for the slower hyperpolarization (relative to Figures 4A,B), which was not complete after 50 ms. Two sweeps are shown, one with two aEPSCs at 50 ms (magenta) and another with two aEPSCs at 800 ms (black). Inset numbers indicate aEPSC input and spike output for each event. (B) Compare to Figure 5B. After 200–800 ms at −80 mV, spike count (mean ± s.e.m.) exceeded its homeostatic level at −65 mV in response to 1 (black), 2 (red), and 4 aEPSCs (blue), in a separate population of 25 neurons that contributed data only to this figure. (C) Average spike counts (mean ± s.e.m.) as a function of EPSG count at −65 mV (black) and after 800 ms at −80 mV (green). Compare to Figure 8A.

