
Figure 12.
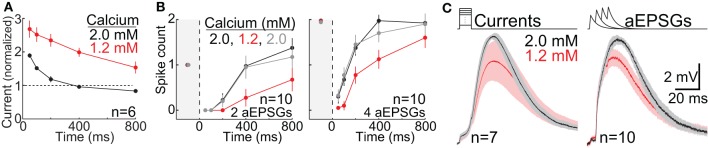
Reduced recovery of excitability in 1.2 vs. 2.0 mM calcium. Our standard protocols were performed in 2.0 mM followed by 1.2 mM calcium in 17 neurons. (A) In the square-wave protocol (Figure 2), recovery of excitability at −80 mV was reduced in 1.2 mM (red) vs. 2.0 mM calcium (black), as measured by the minimal “threshold” current required to evoke a sodium spike. Plot is analogous to Figure 3. Currents in each cell were divisively normalized to the corresponding threshold current at −65 mV (386 ± 25 pA in 2.0 mM calcium, 245 ± 39 pA in 1.2 mM calcium, mean ± s.e.m.). (B) In the aEPSG protocol (Figure 4), recovery of spike counts at −80 mV was reduced in 1.2 mM calcium (2 aEPSGs at left, 4 aEPSGs at right). The protocol in each cell was performed sequentially in 2.0 (black), 1.2 (red), and again in 2.0 mM calcium (gray). (C) Population TTDs (mean ± s.e.m.) in response to square-wave current (left) and aEPSG inputs (right). The input conditions (current or aEPSG count) in each cell were selected to maximize TTD amplitude in the absence of sodium spikes, and were averaged across times at −80 mV (100–800 ms) (see Materials and Methods). TTDs were evoked in 2.0 and 1.2mM calcium in each cell, and responses were normalized to the peak TTD amplitude in 2.0mM calcium prior to averaging across cells. One cell tested in the square-wave protocol was included here (and in the statistics presented in Results), but excluded in (A), because of a large and sudden change in input resistance that occurred after collection of data at 50 and 800 ms in 1.2 mM calcium (thus data collected subsequently at 100, 200, and 400 ms in 1.2 mM calcium was discarded).