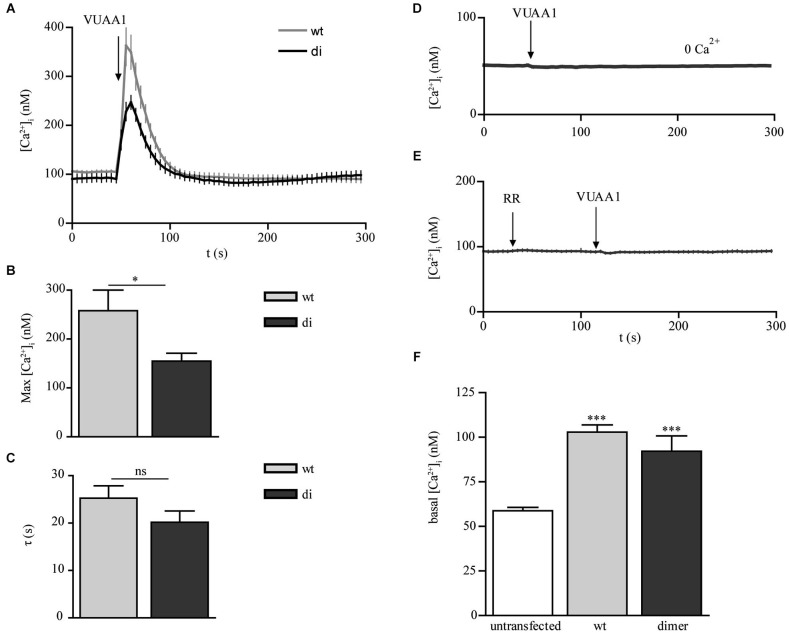
Figure 2.
Calcium responses to OR agonist in CHO cells expressing Orco wt and Orco di. (A) Free intracellular calcium concentration [Ca2+]i in Orco wt and Orco di expressing cells in response to application of VUAA1 (100 μM) (wt, n = 37; di, n = 28). (B,C) Comparison of maximum [Ca2+]i (B) and decay time constants (C) in cells expressing Orco wt and Orco di as in (A). (D,E) [Ca2+]i in Orco di upon VUAA1 (100 μM) stimulation in (D) Ca2+ free bath solution and (E) in presence of Ruthenium red (0 Ca2+, n = 27; RR, 100 μM, n = 26). (F) Comparison of basal [Ca2+]i levels in non-transfected cells (n = 40) and Orco wt or Orco di expressing cells as in (A). Data represent mean ± SEM; unpaired t-test, * p < 0.05, *** p < 0.001, ns, not significant.

