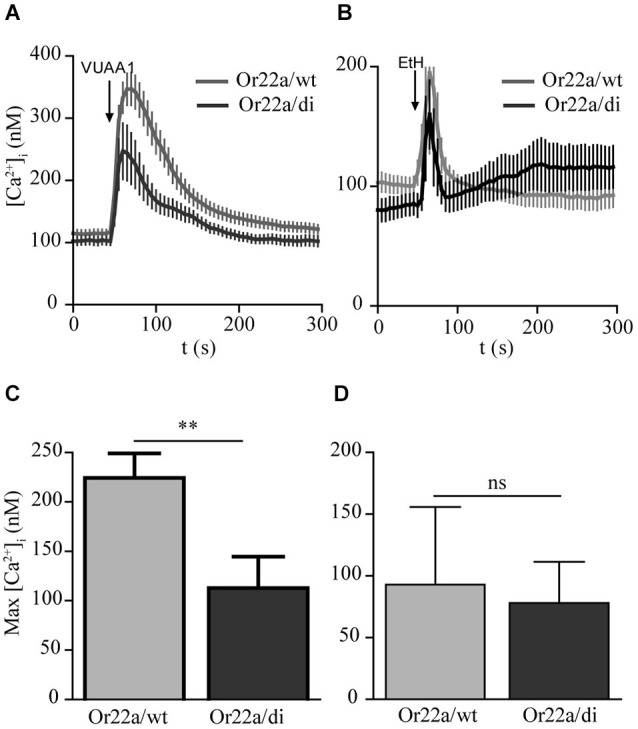
Figure 5.

Calcium responses in cells coexpressing Or22a and Orco wt or Orco di. (A,B) [Ca2+]i upon application of VUAA1 (100 μM) and ethyl hexanoate (EtH, 100 μM) for Or22a coexpressed with Orco wt (VUAA1, n = 19 EtH, n = 7) and Orco di (VUAA1, n = 13 EtH, n = 6). (C,D) Comparison of maximum [Ca2+]i in cells coexpressing Or22a with Orco wt or Orco di as in (A,B). Data represent mean ± SEM; unpaired t-test, ** p < 0.01, ns, not significant. The curve for Or22a/wt corresponds to a data set shown in Mukunda et al., 2014, Figure 6A.
