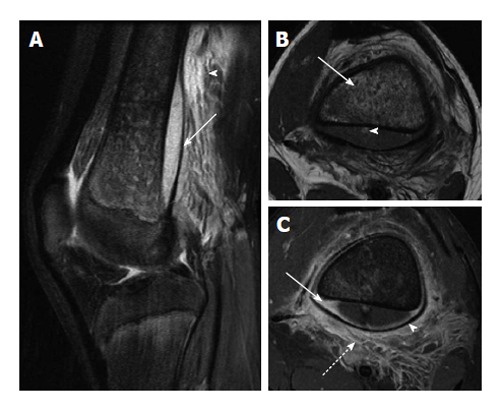
Figure 5.

Osteomyelitis with subperiosteal abscess. A: Sagittal T2-weighted image with fat suppression shows a large subperiosteal abscess (solid arrow) with adjacent soft tissue edema (arrowhead); B: Axial T1-weighted image shows heterogeneous T1 hypointense marrow signal (solid arrow). Note small T1 hyperintense focus in the posterior subperiosteal fluid collection (arrowhead) indicative of a fat globule; C: Axial T1-weighted post-contrast image demonstrates peripheral enhancement of the subperiosteal abscess (solid arrow), significant periosteal elevation (arrowhead) and adjacent soft tissue inflammation (dashed arrow).
