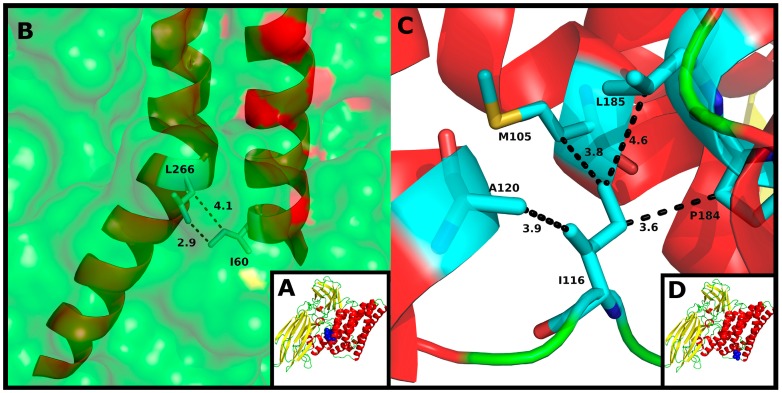
Figure 6.
(A) Tertiary structure of Cry1Ia12. Domain I is colored red, whereas Domains II and III are colored yellow; (B) Detailed view of the interaction between L266 within the toxin and I60 in helix α-1. Distances are shown as dashed lines and are measured in angstroms (Å). α-Helix secondary structure is represented in red, and the protein surface is represented in green; (C) Detailed view of I116 interactions with the hydrophobic residues M105, A120, P184 and L185 in Domain I. Distances are shown as dashed lines and measured in angstroms (Å). α-Helices are colored red, and loops are colored green; (D) Tertiary structure of Cry1Ia12. Domain I is colored red, whereas Domains II and III are colored yellow.

