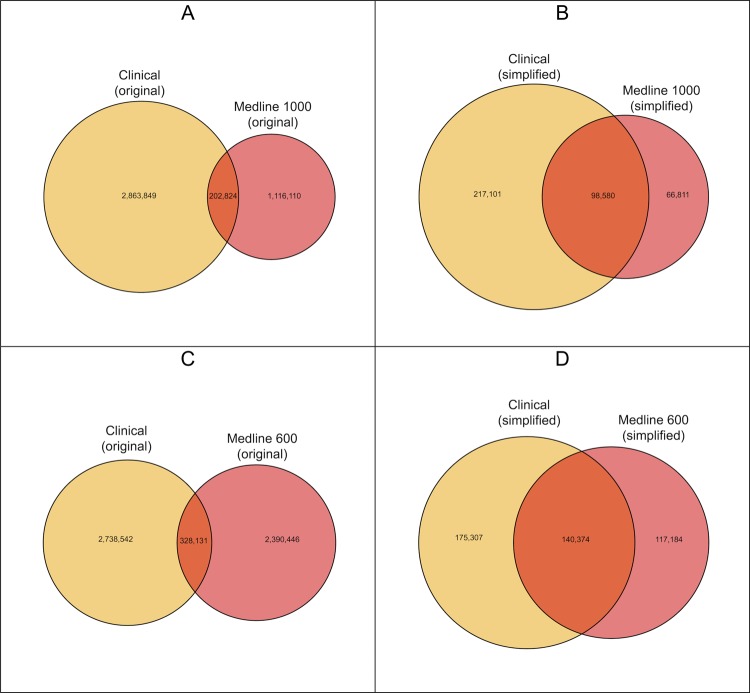
Figure 3.
Venn diagrams showing overlap of pairwise associations found in the Clinical and Medline datasets. Panels A and C display the Original datasets, where as Panels B and D represent the Simplified datasets. The left most area in each panel is the one most likely to contain novel associations not previous described in the literature as they are found in the Clinical dataset but not the Medline dataset.

