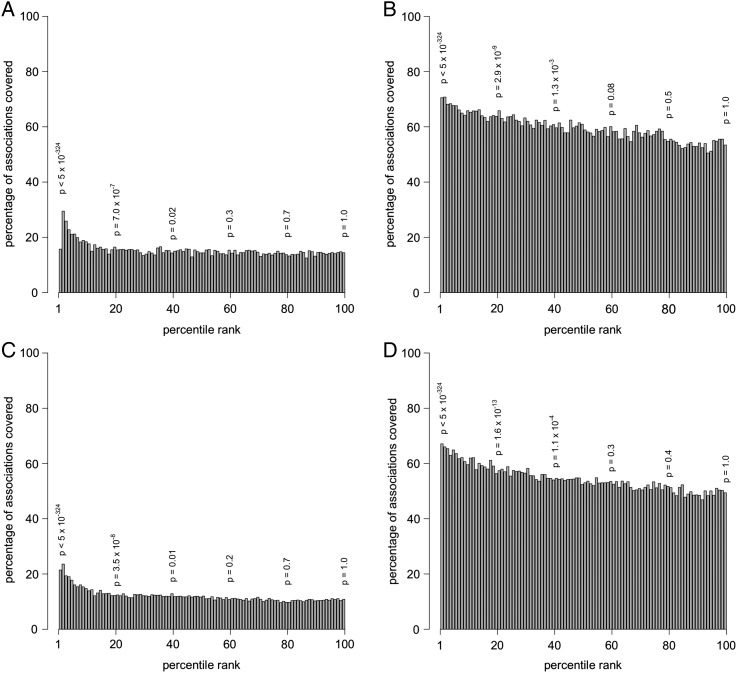
Figure 5.
Bar plots showing the relationship between the rank of an association in the Medline dataset and the probability of the association appearing in the Clinic dataset. (A) Medline 1000 (original) appearing in Clinical (original); (B) Medline 1000 (simplified) appearing in Clinical (simplified); (C) Medline 600 (original) appearing in Clinical (original); (D) Medline 600 (simplified) appearing in Clinical (simplified). The p-values shown represent the significance of the Medline associations at that percentile.

