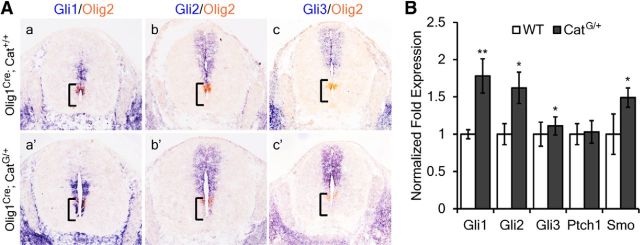
Figure 5.
Expression of Gli genes in the CatG/+ embryonic spinal cords. A, Transverse sections of spinal cord from E13.5 of WT (a–c) and CatG/+ (a′–c′) mice are subjected to ISH with Gli1, Gli2, and Gli3 riboprobes, followed by ISH with Olig2 riboprobe. B, Quantitative reverse-transcription PCR analysis of the expression level of Gli1, Gli2, Gli3, Smo, and Ptch1 in E18.5 spinal cord from WT and CatG/+ mice. All values are presented as means ± SD. *p < 0.05; **p < 0.01.

