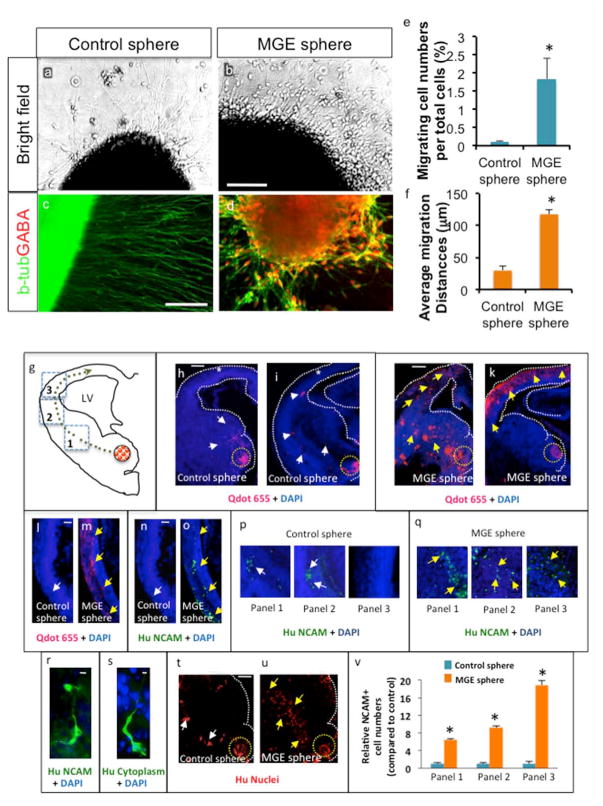
Fig. 4.

Migration property of human MGE cells. a-d. MGE or Cortical spheres derived from H9 hESCs were plated on Matrigel substrate and analyzed 5 days after plating by brightfield microscopy or immunocytochemistry. Scale bar: 100 μm. e. Quantification of migrating cell numbers per sphere after 5 days in culture on Matrigel. Migrating cell numbers were normalized to total cell numbers in the sphere (Mean±S.E.M.; n=3, P<0.05, two tailed t-test). f. ImageJ software was used to assess each cell migration distance between the edge of the sphere and the center of the migrating cell body (Mean±S.E.M.; n=3, P<0.05, two tailed t-test). g. Schematic of transplantation of control and MGE spheres (red dotted circle) into the ventral telencephalon. Green dotted line points to route of migration of cells that emanated from the spheres. Dotted squares outline panels/areas in which the numbers of migrating cells were quantified. h-k. Low magnification images (4.2x) of control and MGE sphere transplantations into E13.5 CD1 telencephalon. Yellow dotted circle indicates site of transplantation. Many cells were located close to the site of control sphere transplantation (white arrows, h) and few cells were observed migrating from ventral to dorsal telencephalon (white arrows, i). White stars (h, i) highlight decreased cell migration into dorsal telencephalon. In MGE sphere transplantation, many QDot® labeled cells migrated into the dorsal telencephalon (yellow arrows, j, k). White dotted lines (h-k) outline telencephalic boundaries. l-o. Images (10x) of the dorsal telencephalon showing cells labeled with QDot® nanocrystals (l, m) and anti-NCAM (n, o). White arrows point to decreased QDot® (l) and NCAM label (n) and yellow arrows point to many QDot® (m) and NCAM (o) labeled cells in the dorsal telencephalon. p-q. Migration of NCAM-labeled control (p) and MGE (q) cells in three panels of the telencephalon as illustrated in the schema (g). White arrows (p) point to fewer cells and yellow arrows (q) point to significant number of migrating cells. r. High magnification image (30x) of migrating cells labeled with Human NCAM antibody. s. High magnification images (60x) of migrating cells labeled with human cytoplasm antibody. t-u. Fewer human nuclei positive cells migrated out from control sphere transplantations (white arrows, t) when compared to MGE sphere transplantations (yellow arrows, u). v. Quantification of relative NCAM positive cell numbers from cortical and MGE spheres in three panels of the telencephalon, after normalization using the average total cell numbers from parallel control and MGE spheres (*P< 0.001, n=7). Scale bars: h, 100 μm (applies also to i-k, t, u), l, 50 μm (applies m-o, p, q), r, 25 μm, s, 10 μm. LV: lateral ventricle.
