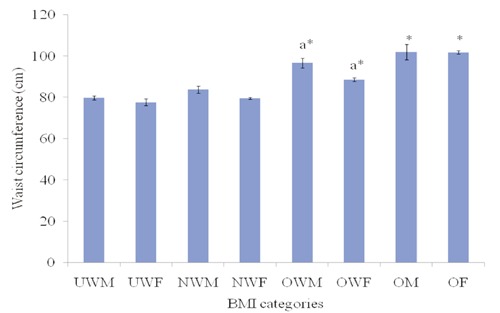
Figure 3.

The waist circumference measurement in different BMI distribution categories. Mean value ± standard error. *Values significantly (P<0.05) different from normal weight. aValues within the same BMI distribution, but significantly (P<0.05) different among gender. UWM = underweight males, UWF = underweight females, NWM = normal weight males, NWF = normal weight females, OWM = overweight males, OWF = overweight females, OM = obese males, OF represent = obese females.
