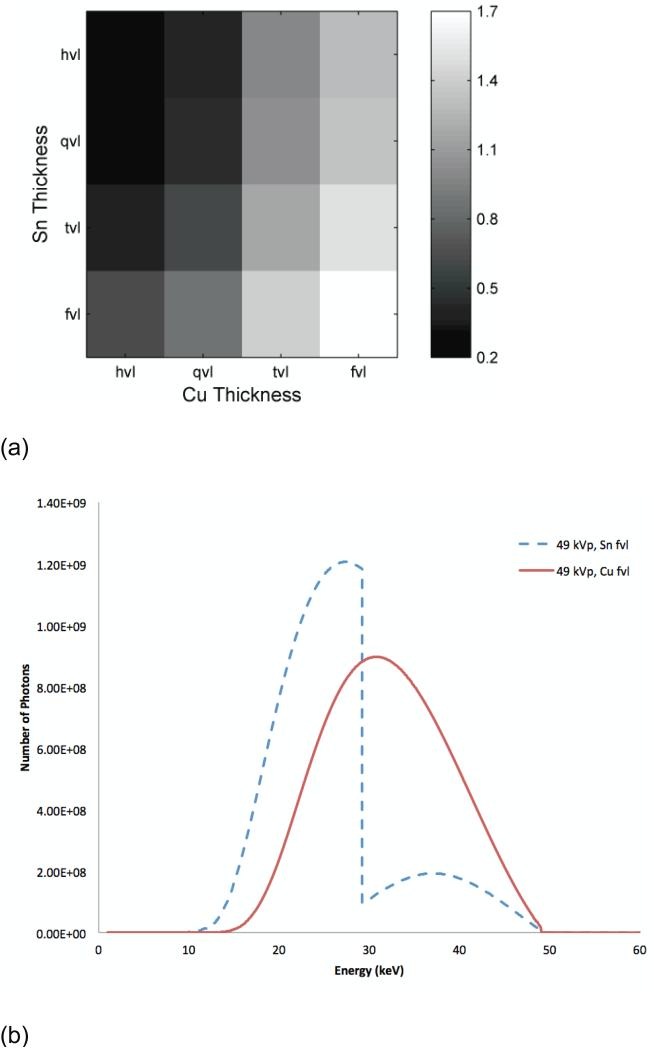
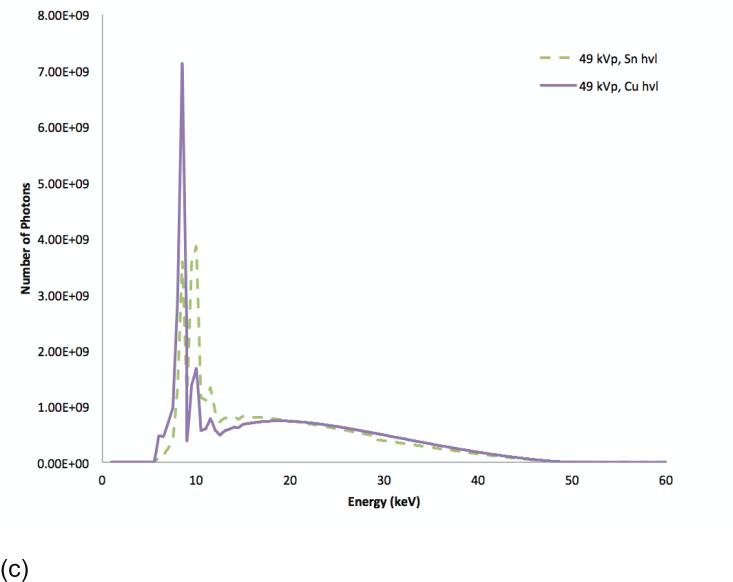
Figure 5.
SdNR as a function of filter thickness at 49 kVp with two different filter materials. The filter thicknesses are indicated in value layers with half-value layer (hvl), quarter-value layer (qvl), twentieth-value layer (tvl), and fiftieth-value (fvl) at tomosynthesis projection dose (a). The spectra corresponding to the optimal (fvl) thicknesses of Sn and Cu filtration, the lower-right corner of (a) diagram (b), and those corresponding to the sub-optimal (fvl) thicknesses of Sn and Cu filtration, the upper-left corner of (a) diagram (c).


