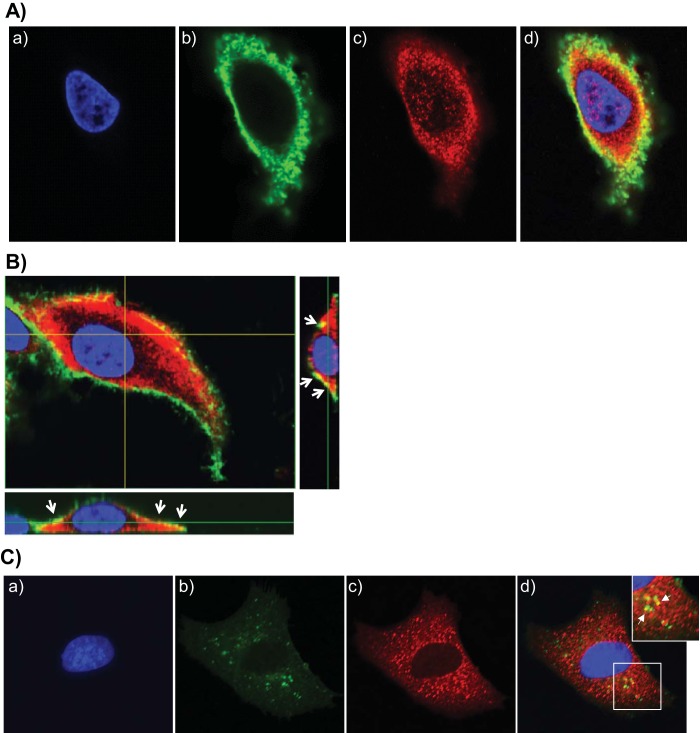
FIG 5 .
CARDS toxin colocalizes with cell surface and intracellular AnxA2. (A) Colocalization of CARDS toxin with cell surface-associated AnxA2. (a to c) A549 cells were incubated with 10 µg of CARDS toxin at 4°C for 1 h, fixed in the presence of DAPI to stain nuclei (blue) (a) and probed with rabbit polyclonal anti-CARDS toxin antibody followed by secondary goat anti-rabbit IgG conjugated with Alexa Fluor 488 (green) (b) and anti-AnxA2 monoclonal antibody (1:500) followed by secondary goat anti-mouse IgG antibody conjugated with Alexa Fluor 555 (red) (c). (d) The merged image shows colocalization of CARDS toxin and AnxA2 at the membrane surface as yellow. (B) Interaction of CARDS toxin with A549 cell surface-associated AnxA2 using confocal laser-scanning microscopy. White arrows indicate the surface colocalization of CARDS toxin with AnxA2 (yellow) based upon serial z sections (0.44 μm; z series) obtained by analyzing x-y scans. (C) Interaction of internalized CARDS toxin with cytoplasmic AnxA2. (a to c) A549 cells were incubated with 10 µg of CARDS toxin at 4°C for 1 h and shifted to 37°C for 1 h, fixed in the presence of DAPI to stain nuclei (blue) (a) and probed with specific antibodies against CARDS toxin (green) (b) and AnxA2 (red) (1:1,000) (c) as described above for panel A. White arrows indicate colocalized intracellular CARDS toxin and AnxA2. (d) Images were collected sequentially from different channels with a confocal laser-scanning microscope and merged to show colocalization (yellow). To demonstrate the colocalization of intracellular AnxA2 and CARDS toxin, a section of the merged image shown by the white square is enlarged (top right panel).

