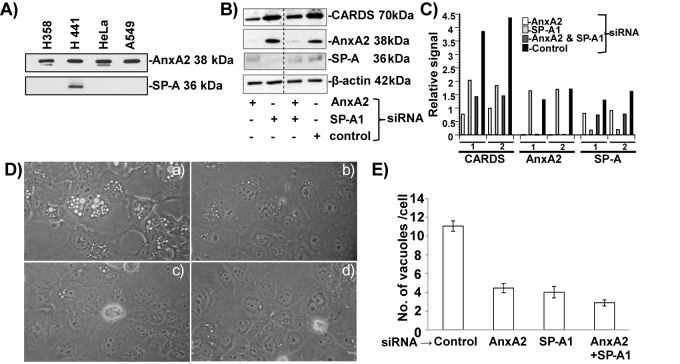
FIG 7 .
CARDS toxin binding and subsequent vacuolization in siRNA-transfected H441 cells. (A) Screening of different human cell lines for the expression of AnxA2 and SP-A. Total cell lysates (5 µg for analysis of AnxA2 and 30 µg for analysis of SP-A) were separated using 4 to 12% gels, transferred to nitrocellulose membranes, and probed with anti-AnxA2 monoclonal antibody (MAb) and anti-SP-A MAb. H441 cells that expressed both AnxA2 and SP-A were used for further studies. (B) Association of CARDS toxin with the cell surface upon suppression of AnxA2 and SP-A expression. H441 cells were transfected with siRNAs specific to AnxA2, SP-A, AnxA2 and SP-A, and control random siRNAs and incubated individually with CARDS toxin (5 µg/ml) for 1 h at 4°C. Five-microgram amounts of total cell lysates were analyzed by immunoblotting with anti-AnxA2 MAb or anti-SP-A MAb and anti-CARDS toxin polyclonal antibody. Comparative β-actin intensities were used as loading controls. (C) Quantification of CARDS toxin relative to AnxA2 and SP-A in siRNA-transfected H441 cells. Using β-actin (loading control), CARDS toxin, AnxA2, and SP-A immunoblot intensities, we calculated the relative signal difference of receptor-mediated association of CARDS toxin, along with expression levels of AnxA2 and SP-A. Data are from two independent experiments (experiments 1 and 2). (D) Suppression of AnxA2 or SP-A or AnxA2 and SP-A expression decreases CARDS toxin-mediated vacuolization in H441 cells. Untreated and siRNA-transfected H441cells were incubated with CARDS toxin (50 µg/ml) for 24 h at 37°C, and vacuole formation was analyzed microscopically. (a) Control random siRNA, (b) AnxA2-siRNA, (c) SP-A1-siRNA and (d) AnxA2 and SP-A1 siRNAs. (E) Quantification of numbers of CARDS toxin-induced vacuoles in H441 and siRNA-transfected H441 cells at 24 h. As described above for panel C, the cells were incubated with CARDS toxin, and the numbers of vacuoles per cell were counted and compared as described in Materials and Methods.

