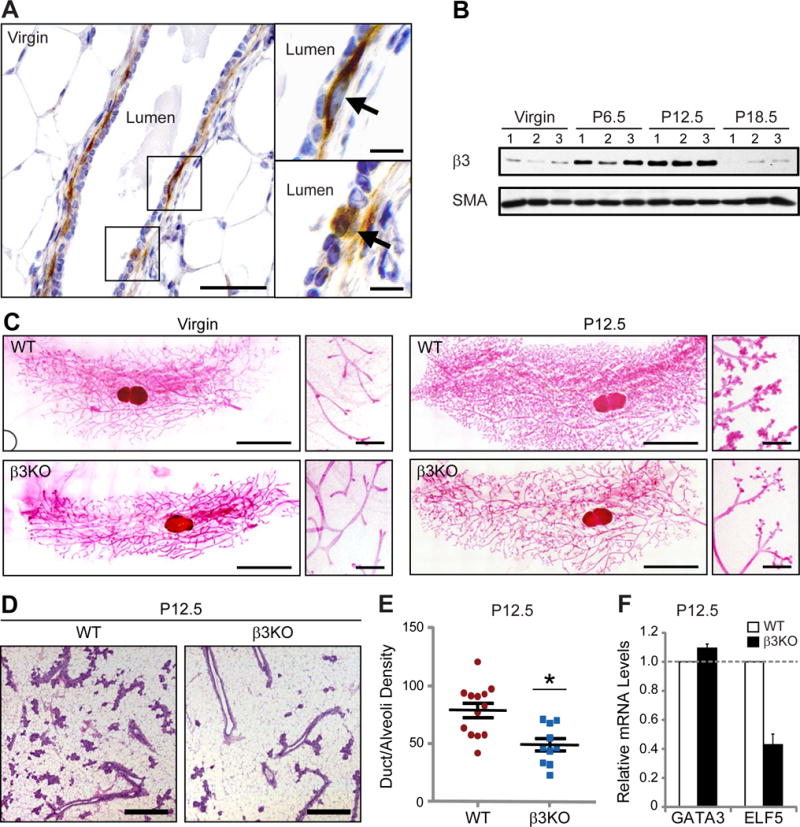
Figure 1. β3 is specifically required for mammary gland development during pregnancy.

(A) Representative images of β3 immunohistochemistry in an adult virgin murine mammary gland. Shown is an example of a duct (left panel) with areas in boxes shown at high-power (right panels). Images on right show β3-expressing cells (arrows) in the basal epithelial cell layer (top, right) and a subset of luminal epithelial cells (bottom, right). Scale bars, 50 μm (left panel) and 10 μm (right panels).
(B) Western blot of whole mammary gland lysates for β3 and α-smooth muscle actin (SMA) (loading control). n=3 mice for each stage.
(C) Mammary gland whole-mounts from virgin and P12.5 WT and β3KO mice. Virgin; WT, n=8, β3KO, n=7, P12.5; WT, n=19, β3KO, n=10. Scale bars, 5 mm (low magnification), and 500 μm (high magnification).
(D) Representative H&E-stained sections from WT and β3KO P12.5 mammary glands. Scale bars, 500 μm.
(E) Quantitation of duct/alveoli density in P12.5 WT versus β3KO H&E-stained mammary gland sections. WT, n=13, β3KO, n=10, P=0.015. Data shown represent the mean ± s.e.m. and were analyzed by Student’s T-test. *P<0.05.
(F) qPCR results displaying the relative amount of GATA3 and ELF5 mRNA in WT and β3KO P12.5 mammary glands. WT, n=11, β3KO, n=9. Each sample was run in triplicate and GAPDH was used as a loading control. Data is displayed as the mean ± s.d. fold change (2−ΔΔCT) in β3KO glands relative to WT. See also Figures S1 and S2.
