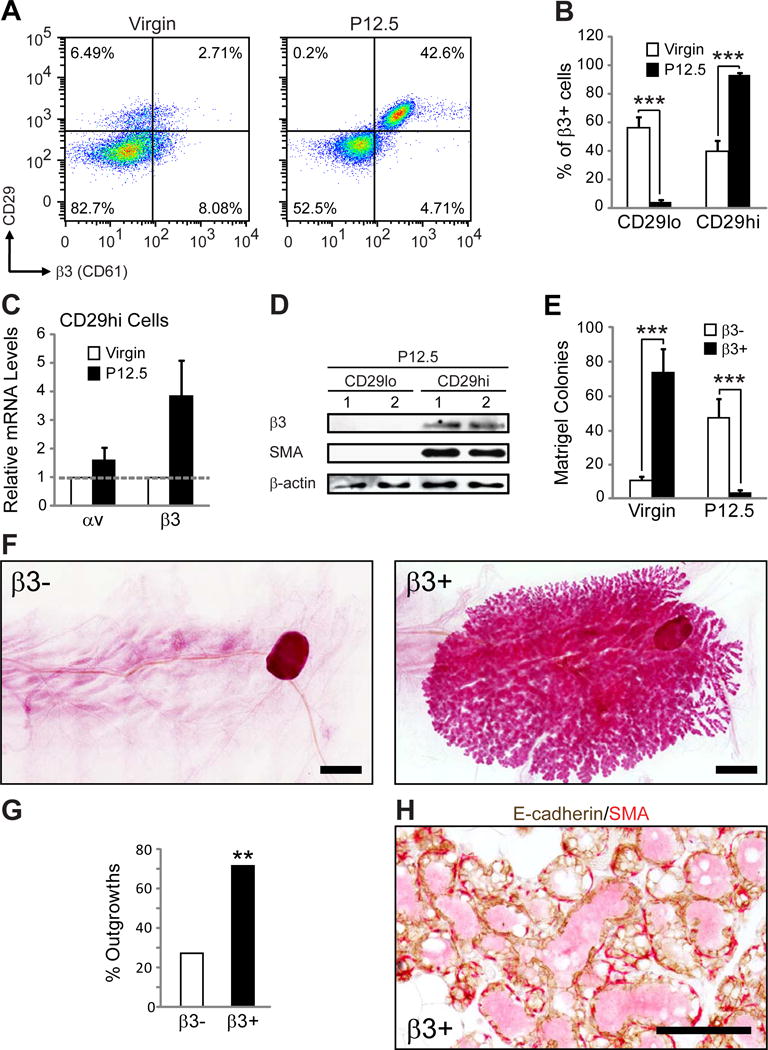
Figure 2. β3 expression is increased in MaSCs during pregnancy.

(A,B) FACS analysis of MaSC/progenitor markers in virgin and P12.5 WT mammary glands. (A) Representative FACS density plots showing the live, Lin−CD24+ cells expressed according to their CD29 (β1 integrin) and β3 status. (B) Histograms showing the percent of Lin−CD24+β3+ cells that are CD29lo or CD29hi. P-values for virgin versus P12.5: CD29lo; P=0.00014, CD29hi; P=0.00008. Data shown are mean ± s.e.m. and were analyzed by Student’s T-tests. ***P<0.001. (A,B) Virgin, n=8, P12.5, n=13.
(C) qPCR data showing the relative levels of αv and β3 mRNA in virgin and P12.5 CD29hi cells. Virgin, n=2 (pooled from 2 mice each), P12.5, n=3. Each sample was run in triplicate and 18S rRNA was used as a loading control. Data is displayed as the mean ± s.e.m. fold change (2−ΔΔCT) in P12.5 relative to virgin glands.
(D) Immunoblot of FACS-sorted Lin−CD24+ CD29lo and CD29hi mammary cells from two different P12.5 WT mice for β3, SMA (basal marker) and β-actin (loading control).
(E) Matrigel colonies from live Lin−CD24+β3+ and β3− cells sorted from virgin or P12.5 WT mice. Virgin, n=4, P=0.00003, P12.5, n=4, P=0.0014. Data represent the mean ± s.e.m. and were analyzed by paired Student’s T-tests. ***P<0.001.
(F–H) Mammary gland outgrowth experiments. (F) Representative images of carmine-stained mammary gland outgrowth whole-mounts from P12.5 Lin−CD24+β3+ and β3− donor cells. Recipients were harvested at lactating day 2. Scale bars, 2 mm. (G) Bar graph showing the frequency of successful mammary gland outgrowths from 10,000 Lin−CD24+β3+ and β3− donor cells from P12.5mice. Statistical analysis was performed by Fisher’s exact test. P=0.006. **P<0.01. (H) Representative image of immunohistochemical staining for E-cadherin (brown) and αSMA (red) in sections from Lin−CD24+β3+ cell outgrowths. Scale bar, 100 μm. (F–H) β3−, n=22, β3+, n=21 mammary glands from 3 independent experiments. See also Figure S3.
