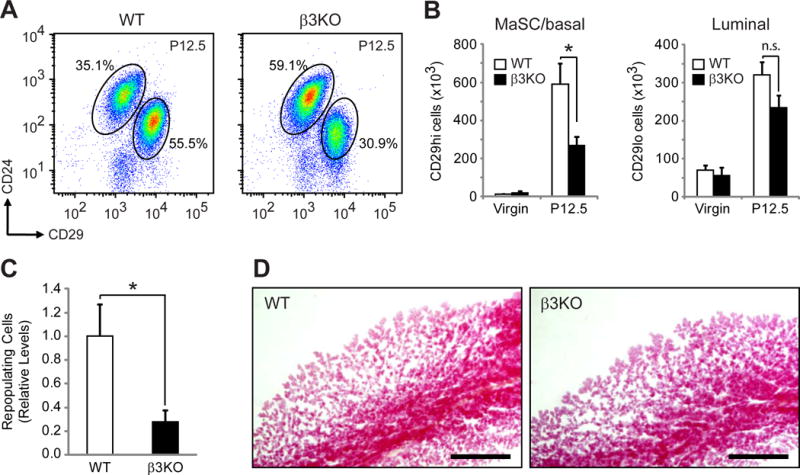
Figure 3. β3 is required for MaSC expansion during pregnancy.

(A,B) FACS analysis of WT and β3KO virgin and P12.5 mammary glands. (A) Representative FACS density plots of WT and β3KO P12.5 mammary cells showing the live, Lin− cells expressed according to their CD24 and CD29 status. (B) Quantitation of the total number of FACS-sorted live Lin−CD24+CD29hi and CD29lo cells from virgin and P12.5 mammary glands. P-values for WT versus β3KO at P12.5: MaSC; P=0.027, Luminal; P=0.09. (A,B) Virgin; WT, n=4, β3KO, n=4, P12.5; WT, n=7, β3KO, n=8.
(C) Histogram showing the relative levels of total repopulating cells in the CD29hi pool from WT and β3KO P12.5 donor mice. n=4 independent experiments. (B,C) Data represent the mean ± s.e.m. and statistical analysis was performed by Student’s T-tests. *P<0.05. (B) n.s. = not significant (P>0.05).
(D) Representative images of carmine-stained WT and β3KO outgrowths harvested at lactating day 2. Scale bars, 1 mm. See also Figure S4.
