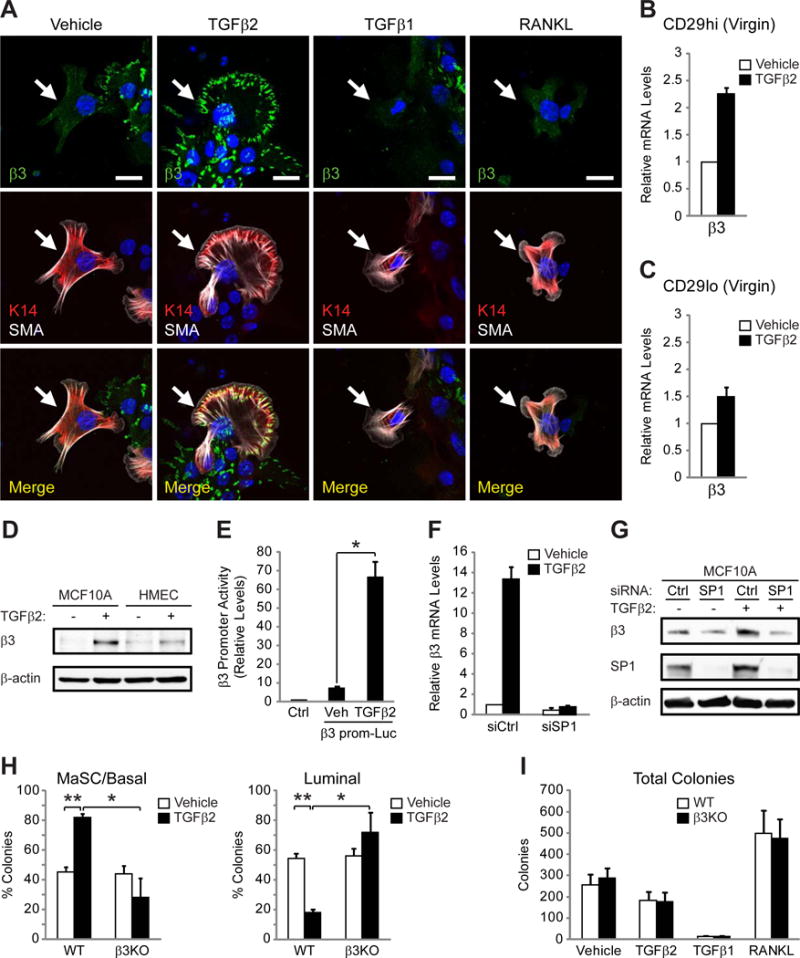
Figure 5. TGFβ2 stimulates β3 expression, enhancing MaSC clonogenicity.

(A) Representative immunofluorescent images of β3 expression in K14+SMA+ cells (arrows) from pooled virgin WT mammary cells stimulated with the indicated growth factors. Nuclei are stained blue in all panels. Scale bars, 20 μm. Data shown are representative of 3 independent experiments.
(B,C) qPCR analysis comparing the relative levels of β3 mRNA in vehicle versus TGFβ2-stimulated CD29hi (B) and CD29lo (C) cells from WT virgin mice. n=2 independent experiments (pooled samples).
(D) Immunoblot for β3 and β-actin (loading control) in MCF10As and human mammary epithelial cells (HMECs) stimulated with TGFβ2 or vehicle control. Data shown is representative of 3 independent experiments.
(E) Histogram displaying the relative luciferase activity in MCF10A cells transfected with an empty vector (Ctrl) or a luciferase reporter plasm id containing the proximal region of the β3 promoter (β3 prom-Luc) and stimulated with vehicle or TGFβ2. n=3 independent experiments. P=0.043.
(F,G) A representative experiment showing the effect of SP1 knock-down on β3 mRNA (F) and protein (G) expression in MCF10A cells stimulated with TGFβ2 or vehicle control. MCF10A cells transfected with control (siCtrl) or SP1 siRNA (siSP1) were analyzed for β3 mRNA expression by qPCR (F) or β3 protein by immunoblot (G) in the same experiment. n=3 independent experiments. (B,C,F) Each sample was run in triplicate and 18S rRNA (B,C) or β-actin (F) were used as loading controls. Data is displayed as the mean ± s.e.m. fold change (2−ΔΔCT).
(H,I) Quantitation of the percent MaSC/basal, and luminal colonies (H) and total colony number (I) from pooled virgin WT and β3KO mammary cells stimulated with the indicated growth factors. n=3 independent experiments. (H) P-values for vehicle versus TGFβ2 in WT cells: MaSC; P=0.0071, Luminal; P=0.0071, and WT versus β3KO cells stimulated with TGFβ2: MaSC; P=0.0413, Luminal; P=0.0413. (E,H,I) Data represent the mean ± s.e.m. and statistical analysis performed by Student’s T-tests. *P<0.05, **P<0.01.
