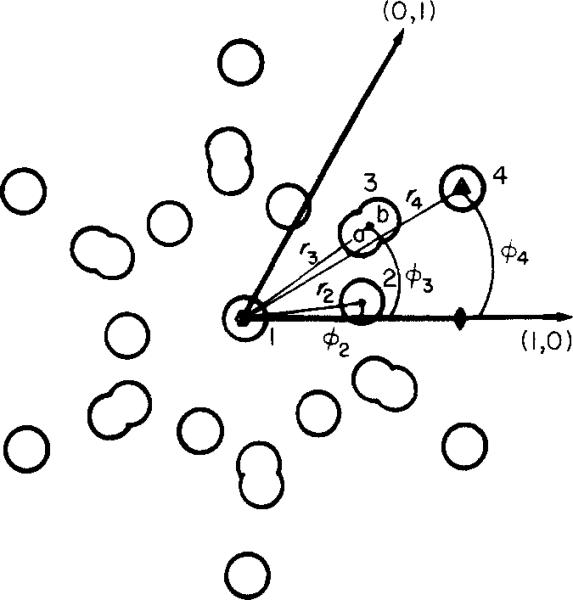
Figure 5.
Cylindrical co-ordinates (ri, Θi) of the 4 features in the connexon model diagrammed in the hexagonal lattice. Feature l on the 6-fold axis can be positive or negative, corresponding to the stain exclusion or penetration; feature 2 is positive, representing the 6 stain-excluding lobes of the connexon; feature 3, corresponding to the 6 peripheral stain concentrations, is modeled by a positive (r3a) and negative (r3b) Gaussian to produce an elliptical shape; feature 4 represents stain exclusion near the 3-fold axis. The size and weight of the Gaussian features are adjusted to best fit the averaged images in Figs 2 and 3.

