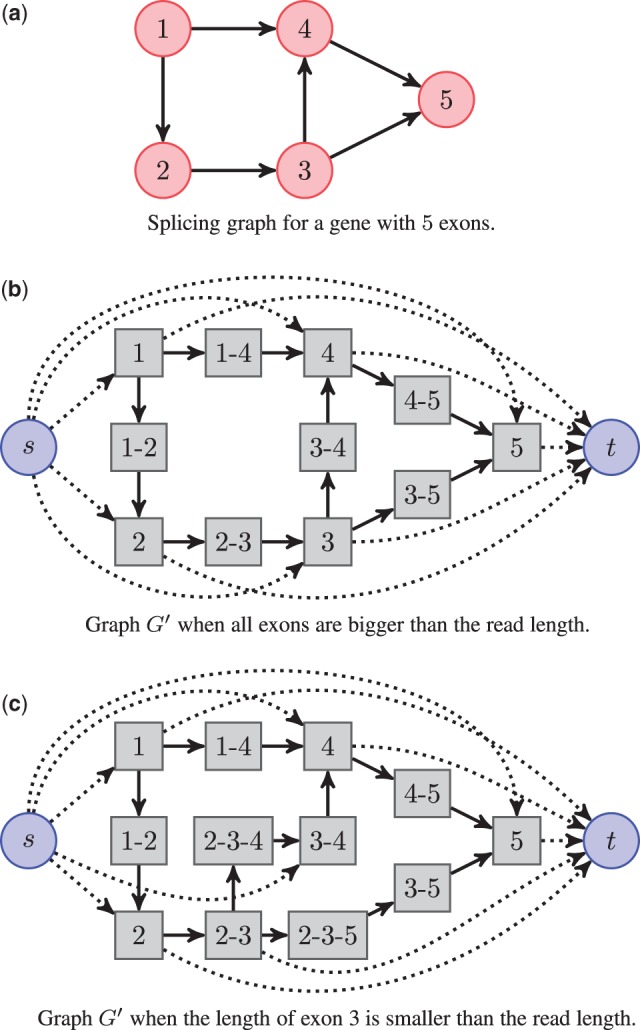
Fig. 1.

Illustration of the graph construction for a gene with 5 exons. The original splicing graph is represented in (a). The 5 exons are represented as vertices and an arrow between two vertices indicates a junction. The nodes of graph in (b) and (c) are bins with positive effective length denoted by gray square, as well as source s and sink t represented as circles. in (b) is the resulting graph when all exons are bigger than the read length. In that case, each bin either corresponds to a unique exon, or to a junction between two exons. in (c) is the resulting graph when the length of exon 3 is smaller than the read length. Some bins involve then more than two exons, here bins and . The source links all possible starting bins, and conversely all possible stopping bins are linked to the sink. There is a one-to-one correspondence between (s, t)-paths in (paths starting at s and ending at t) and isoform candidates. For example, the path corresponds to isoform 1-4-5
