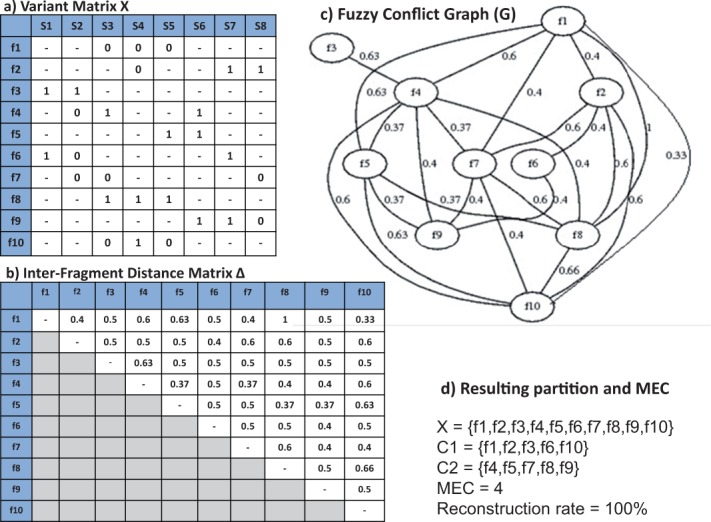
Fig. 1.

An example of variant matrix with 8 SNP sites (a), corresponding distance matrix (b), the fuzzy conflict graph associated with the variant matrix (c) and results of applying FastHap on the data (d). The graph in (c) shows only edges with non-pivot distances
