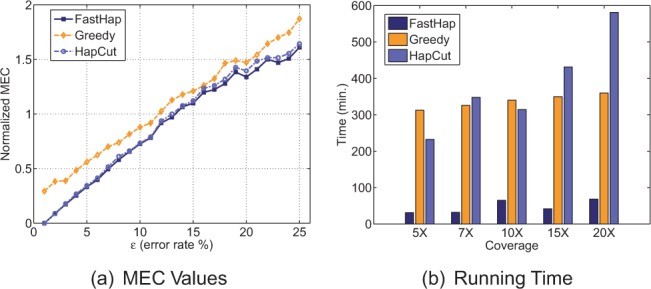
Fig. 4.

Effect of error rate and coverage on performance of different algorithms. The analysis was performed on chromosome 20 (randomly selected) of HuRef dataset. (a) Switching error (MEC) of the three algorithms under comparison as a function of error rate; (b) execution time of the algorithms as a function of coverage
