
Fig. 3.
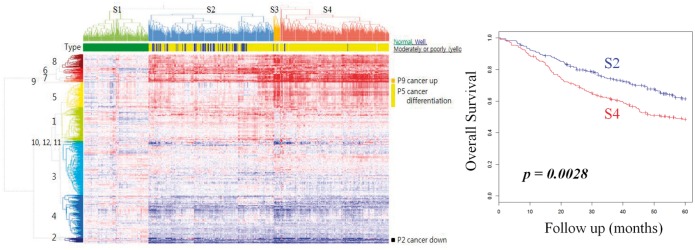
Clustered iPAS of LUAD dataset. Pathways (n = 583) and samples (n = 442) are clustered according to iPAS. Normal samples are clustered at left (S1). Tumors (S2∼S4) deviate from normal in both up- and downregulated directions (darker red and blue, respectively). Sample clusters are well-representing histopathological differentiation status (S2: for well-differentiated LUAD, P < 4.65 × 10⁻¹⁵) and overall survival