
Fig. 1.
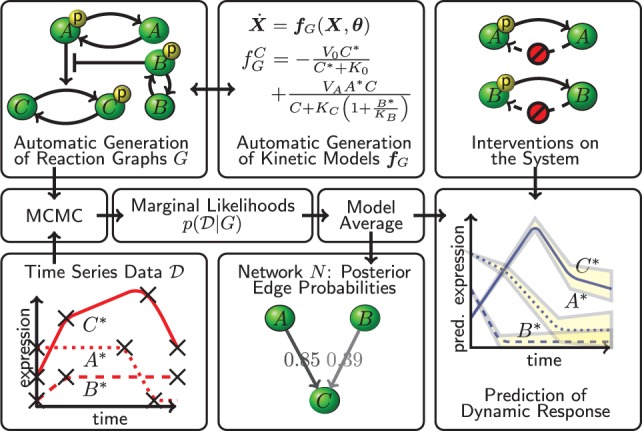
CheMA. Chemical reaction graphs G summarize interplay that is described quantitatively by kinetic equations . Candidate graphs G are scored against observed time course data in a Bayesian framework. A network N gives a coarse summary of the system; marginal posterior probabilities of edges in N quantify evidence in favor of causal relationships. The reaction graph G (and N) is treated as an unknown, latent object and the methodology allows Bayesian prediction of dynamics (including under intervention) in the unknown graph setting