
Fig. 3.
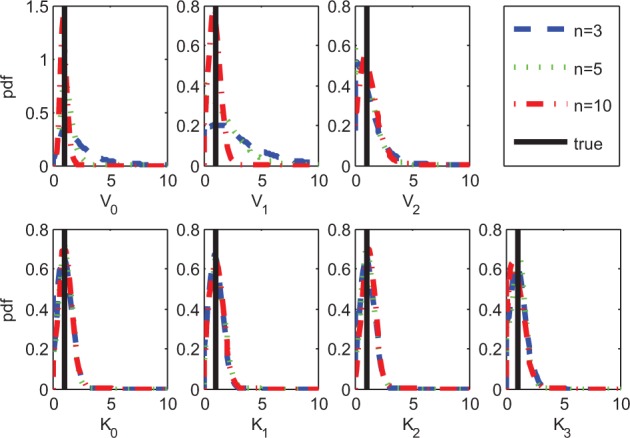
Posterior distributions over kinetic parameters when the graph G is known. As the number of samples n increases, the posterior mass concentrates on the true values much faster for the maximum reaction rates V (top row) than for the Michaelis–Menten parameters K (bottom row)