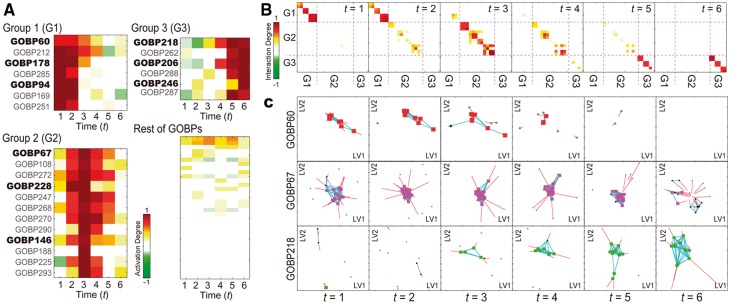
Fig. 2.

Identification of differentially regulated GOBPs and TDNs associated with the GOBPs. (A) Activation degree heat map representing temporal activation of 103 GOBPs. Differentially regulated GOBPs were categorized into Group 1 [G1-GOBPs 60, 178, 94 (bold) and their descendants (non-bold)], Group 2 (G2-GOBPs 67, 228, 146 and their descendants) and Group 3 (G3-GOBPs 218, 206, 246 and their descendants). (B) Interaction degree heat maps showing temporal associations among the GOBPs in Groups 1–3. Color bars, gradients of the activation (A) and interaction degrees (B). (C) Inferred TDNs for GOBPs 60, 67 and 218 in Group 1 (first, second and third rows, respectively). Colored nodes at each t represent the linked nodes with for k = 60, 67 or 218. Black nodes at t represent the linked nodes with , but for k = 60, 67 or 218, and gray nodes at t represent colored or black nodes in or . Blue and red lines at t show the edges among DRNs () and the displacement of DRNs from t − 1, respectively
