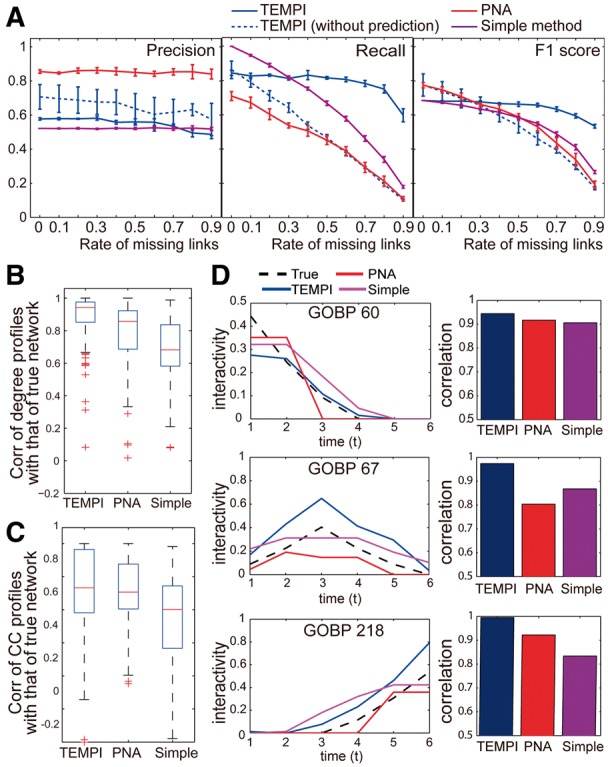
Fig. 3.

Comparison of TEMPI with two previous methods. (A) Precision, recall and F1 score for TEMPI-, PNA- and Simple- with up to 90% removal of the input PPIs. The performance can vary depending on which PPIs are removed. Thus, we performed 10 times of random samplings. Data are represented as mean ± SD from the samplings. (B–C) Distributions of correlations of temporal profiles of degrees (B) and CC (C) in the three s with those in the true . (D) Changes in the interactivities of GOBPs 60, 67 and 218 in the three s and the true (Left) and correlations between the interactivities in the inferred s and the true (Right). See the legend for the lines used for the three methods
