
Fig. 3.
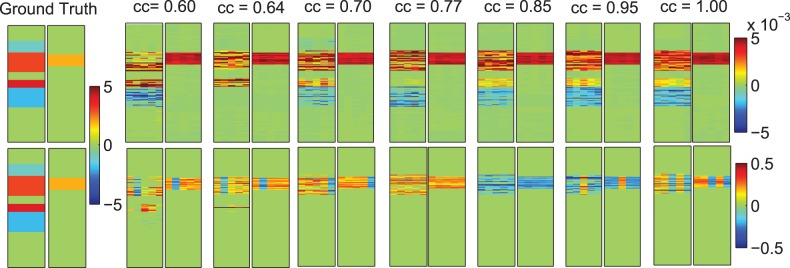
Five-fold trained weights of u and v. Ground truth of u and v are shown in the most left two panels. KG-SCCA results (top row) and PMA results (bottom row) are shown in the remaining panels, corresponding to true correlation coefficients (CCs) ranging from 0.6 to 1.0. For each panel pair, the five estimated u values are shown on the left panel, and the five estimated v values are shown on the right panel