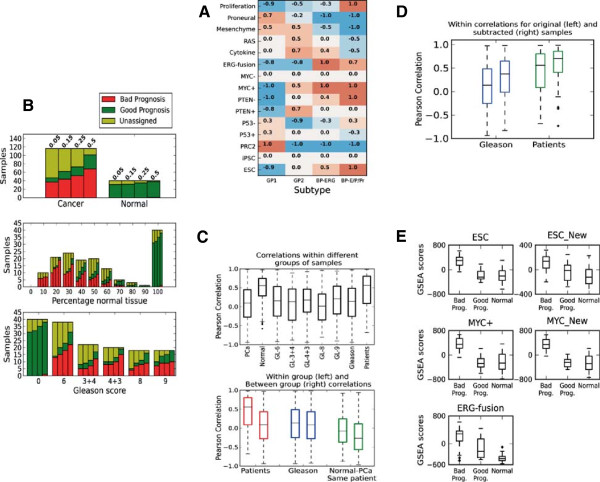
Figure 1.

Gene signatures are consistent within samples from the same patient, but are also affected by tissue composition within each sample. A) Numerical assessment of signatures for four subtypes of prostate cancer based on the heatmap in Figure four(B) in Markert et al. [3]. B) Assignment of PCa samples to subtypes with poor prognosis and subtypes with bad prognosis. The bars show number of samples assigned to the good and bad prognosis subtypes at different p-value thresholds (0.05, 0.15, 0.25 and 0.5 from left to right). B-Top) At a p-value threshold of 0.05 (0.25) 37 (52) out of 116 PCa samples are assigned with bad prognosis, and 10 (21) with good prognosis, while 31 (35) out of 40 normal samples are assigned with good prognosis. B-Middle) Sample assignment is strongly dependent on the relative amounts of cancer and normal tissue in each sample. B-Bottom) PCa sample assignment did not depend on Gleason score, and samples are equally likely to be assigned with poor and good prognosis regardless of Gleason score. C-Top) Signature correlations between PCa samples from the same patients are better than signature correlations between samples with the same Gleason scores. This was also the case when samples from the same patient had different Gleason scores. C-Bottom) Signature correlations within and between various sample groups. Normal samples are more similar to PCa samples when taken from the same patient (Normal-PCa – Same patient) . D) Subtracting the average normal signature improves sample similarity within patient and Glesaon grooups. E) Bad prognosis samples show elevated scores in MYC, ESC and ERG-fusion gene sets. The three samples sets are: i: Bad prog) 54 PCa samples bad prognosis (cluster 1, Figure 2) ii: Good prog) 21 PCa samples initially assigned with good prognosis (p<0.25, Table 1A) and iii: Normal) 40 normal samples.
