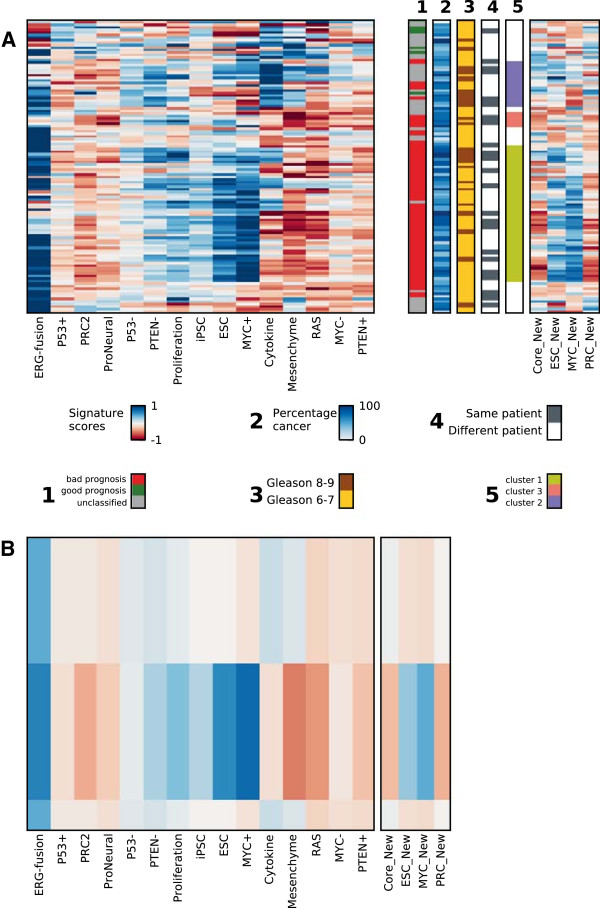
Figure 2.

Hierarchical clustering of signatures for all PCa samples reveal one dominating cluster (cluster 1, green) with low Gleason scores, classified with poor prognosis profiles, and enriched for ERG-fusion, ESC and MYC + gene sets. Signature scores after subtraction of the average normal signature were used for the clustering. A) Heatmap of signatures based on GSEA scores for the 15 gene sets in 116 cancer samples. The additional bars show meta-data for each sample, from left to right: 1) Samples assigned with poor prognosis (red), good prognosis (green) and unclassified (grey) at a p-value threshold of 0.25; 2) Percentage cancer tissue, 3) Gleason score, Gleason 6-7 (yellow), Gleason 8-9 (brown); 4) Whether a sample clusters with an adjacent sample from the same patient, yes (dark blue), no (white),5) Interesting clusters found in the heatmap, see main text for details. Two of the most important gene sets were validated by four related gene sets from recent studies, where the ESC_New, MYC_New and PRC_New gene set values correlated well with the previous ESC, MYC + and PRC2 gene set scores. Note that these four gene sets were not used for the hierarchical clustering, and are thus independent validations. B) Average gene set values over all samples in cluster 1, and compared to the average over all other cancer samples, emphasizing the characteristics for cluster 1.
