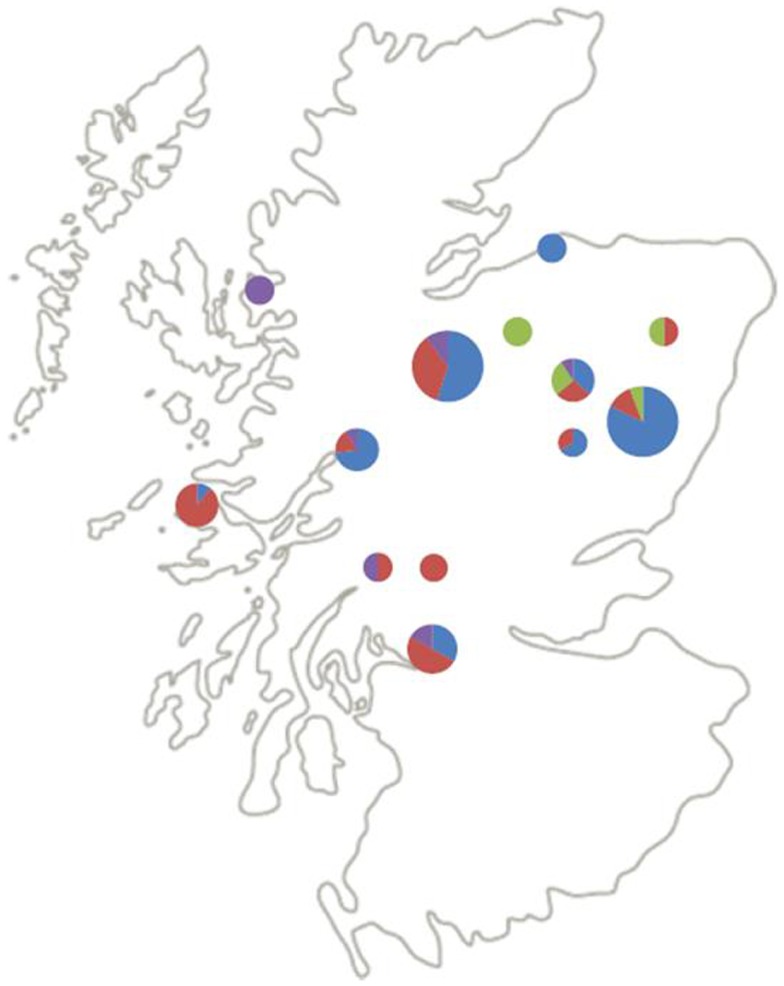
Figure 2.
Distribution and relative abundance of B. burgdorferi s.l. genospecies across Scotland. Blue = B. afzelii, red = B. garinii, purple = B. valaisiana, green = B. burgdorferi s.s. The size of the pie charts indicates the number of samples genotyped at that site (1–5, 6–10, and 11–20 samples for small, medium, and large pie charts, respectively).

